LoadSANS1MLZ v1#
Summary#
Load the SANS1_MLZ raw data file to the mantid workspace.
Properties#
Name |
Direction |
Type |
Default |
Description |
|---|---|---|---|---|
Filename |
Input |
string |
Mandatory |
Name of SANS-1 experimental data file. Allowed extensions: [‘.001’] |
OutputWorkspace |
Output |
Mandatory |
Name of the workspace to store experimental data. |
|
Wavelength |
Input |
number |
0 |
Wavelength in Angstrom. If 0, the wavelength will be read from the data file. |
Description#
This algorithm loads the raw data files produced by the SANS-1 instrument at MLZ into mantid workspace.
The loader reads out the detector positions from the instrument definition file (IDF) and places the detectors accordingly. The Instrument View window can be activated by right clicking on the loaded workspace and selecting the “Show Instrument”.
Example - Loads raw SANS-1 data file with extension .001.
ws = LoadSANS1MLZ("D0122881.001")
numHistograms = ws.getNumberHistograms()
print('This workspace has {0} spectra.'.format(numHistograms))
Output:
This workspace has 16386 spectra.
The information from all sections of the raw data file is written to Sample Logs. To get access to Sample Logs, a user needs to use the keys method; the key consists of a section’s title followed by a dot and the parameter of interest that belongs to that section. The most relevant parameters, such as “wavelength”, “collimation”, “l2”, “duration”, “monitor1”, “monitor2”, “thickness” and “position” can be accessed directly using the parameter name.
Example - Access to the information
ws = LoadSANS1MLZ("D0122881.001")
run = ws.getRun()

det_h_angle = run.getLogData('setup.DetHAngle').value   # ('section.parameter')
wavelength = run.getLogData('wavelength').value

print(f"DetHAngle is {det_h_angle} degrees.")
print(f"Wavelength is {wavelength} Angstrom.")
Output:
DetHAngle is 0.0 degrees.
Wavelength is 4.9 Angstrom.
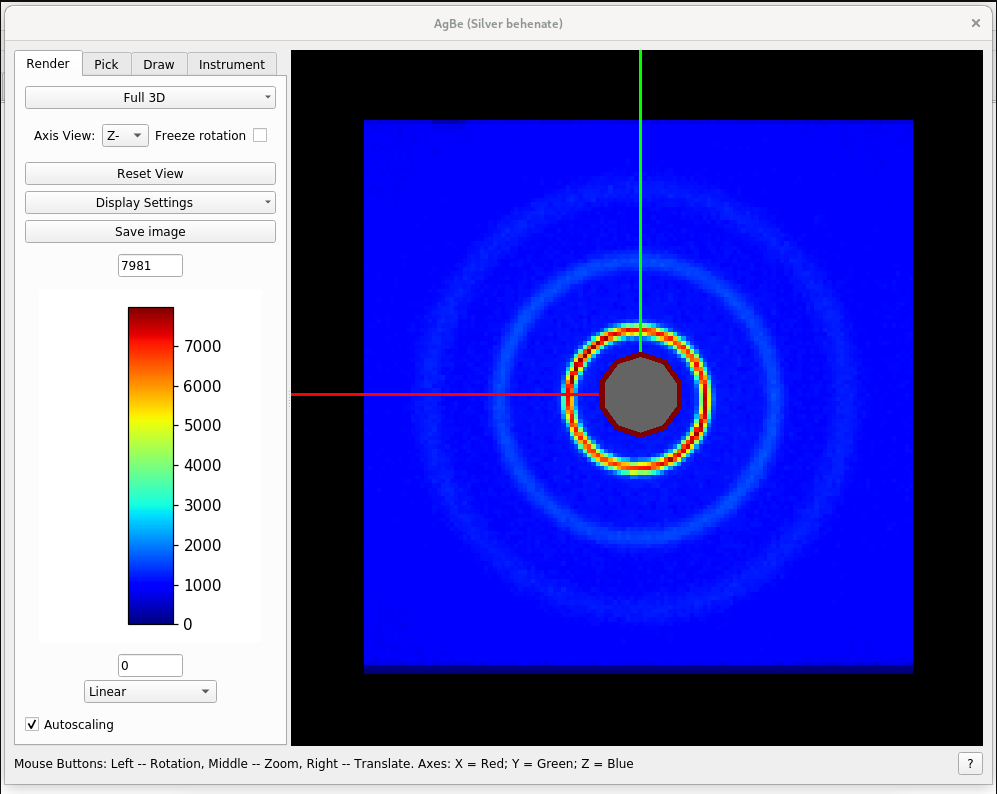
Data visualization#
Whenever the loader is used then the output is written to a 2D Workspace. As a result, the data can be visualised by right clicking on the loaded workspace and selecting the “Show Instrument” option, which activates the Instrument View tool.
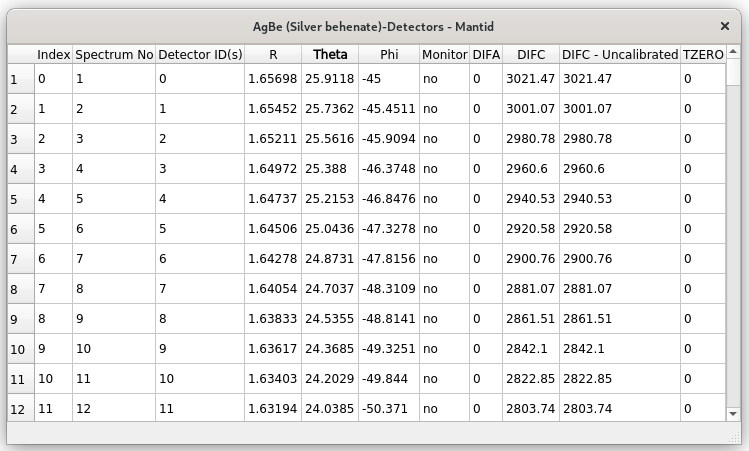
By selecting the “Show Detectors” option, you can activate the Detector Table, which contains Workspace Indices, Spectrum Numbers, Detector IDs and locations of the detectors, together with a flag showing if a detector is a monitor.
Note
To run these usage examples please first download the usage data, and add these to your path. In Mantid this is done using Manage User Directories.
Categories: AlgorithmIndex | Workflow\MLZ\SANSOne | DataHandling\Text
Source#
Python: LoadSANS1MLZ.py