Plus v1#
Summary#
The Plus algorithm will add the data values and calculate the corresponding error values in two compatible workspaces.
See Also#
Properties#
Name |
Direction |
Type |
Default |
Description |
|---|---|---|---|---|
LHSWorkspace |
Input |
Mandatory |
The name of the input workspace on the left hand side of the operation |
|
RHSWorkspace |
Input |
Mandatory |
The name of the input workspace on the right hand side of the operation |
|
OutputWorkspace |
Output |
Mandatory |
The name to call the output workspace |
|
AllowDifferentNumberSpectra |
Input |
boolean |
False |
Are workspaces with different number of spectra allowed? For example, the LHSWorkspace might have one spectrum per detector, but the RHSWorkspace could have its spectra averaged per bank. If true, then matching between the LHS and RHS spectra is performed (all detectors in a LHS spectrum have to be in the corresponding RHS) in order to apply the RHS spectrum to the LHS. |
ClearRHSWorkspace |
Input |
boolean |
False |
For EventWorkspaces only. This will clear out event lists from the RHS workspace as the binary operation is applied. This can prevent excessive memory use, e.g. when subtracting an EventWorkspace from another: memory use will be approximately constant instead of increasing by 50%. At completion, the RHS workspace will be empty. |
Description#
OutputWorkspace = LHSWorkspace + RHSWorkspace
The algorithm will perform the + operation on the data and associated errors from any two compatible workspaces. Workspaces are compatible if:
The sizes of the two workspaces are compatible (see below)
If the two workspaces contain Y bins then the values in these must be identical
the units of the axes match
the distribution status/counts units match
For information about how errors are handled and propagated see Error Propagation.
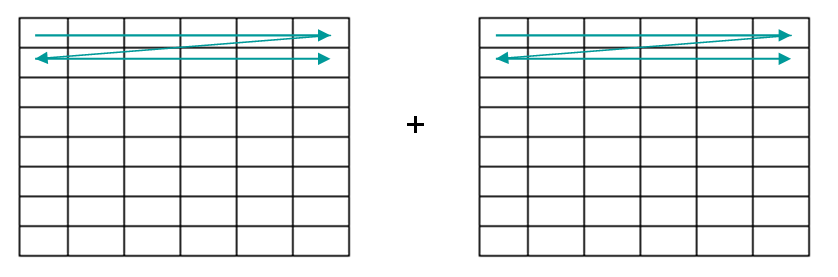
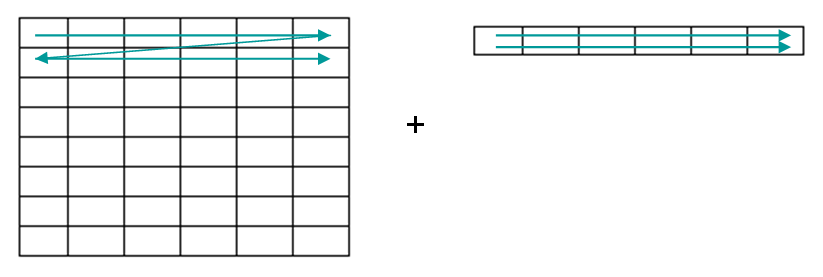
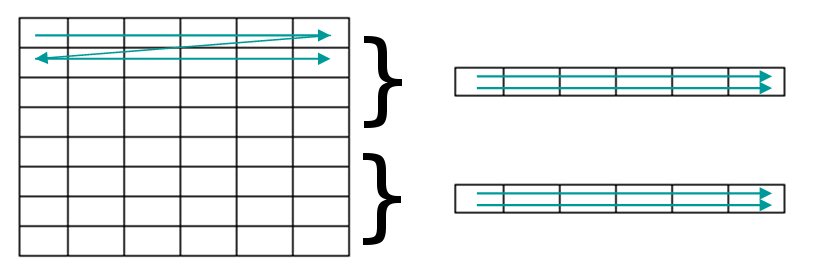
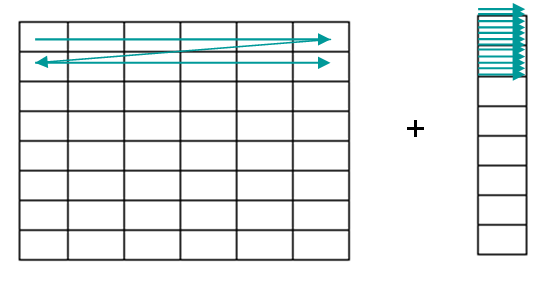
Compatible Sizes#
Workspaces are compatible if they are identically sized in which case the values of each cell within each histogram are added individually. The green arrows shows the order in which the data is added. |
|
They are also compatible if they match the size dimension horizontally, in which case the same values are added to each histogram in the workspace. |
|
If AllowDifferentNumberSpectra is True, then the LHS and RHS spectra are matched using detector IDs. The corresponding spectra are added to the matching counterpart. |
|
If they match in size vertically then the data values will be added to each bin of the histogram. |
|
Finally a workspace containing a single value is compatible to any workspace, in which case the same value will be added uniformly to every bin in each histogram.
EventWorkspace note#
For EventWorkspace, the event lists at each
workspace index are concatenated to create the output event list at the
same workspace index. Note that in some (rare *) cases, these
event lists might be from different detectors; this is not checked
against and the event lists will be concatenated anyway. This may or may
not be your desired behavior. If you wish to merge different
EventWorkspaces while matching their detectors together, use the
MergeRuns v1 algorithm.
* This could happen, for example, if the workspace operands have not both been processed in an identical fashion and the detectors have somehow been grouped differently.
Usage#
Example - Plus as an Algorithm
# create histogram workspaces
dataX1 = [0,1,2,3,4,5,6,7,8,9] # or use dataX1=range(0,10)
dataY1 = [0,1,2,3,4,5,6,7,8] # or use dataY1=range(0,9)
dataE1 = [0,1,2,3,4,5,6,7,8] # or use dataE1=range(0,9)
dataX2 = [0,1,2,3,4,5,6,7,8,9] #X-values must be identical
dataY2 = [2,2,2,2,2,2,2,2,2]
dataE2 = [3,3,3,3,3,3,3,3,3]
ws1 = CreateWorkspace(dataX1, dataY1, dataE1)
ws2 = CreateWorkspace(dataX2, dataY2, dataE2)

# perform the algorithm
ws = Plus(ws1, ws2)

print("The X values are: " + str(ws.x(0)))
print("The Y values are: " + str(ws.y(0)))
print("The updated Error values are: " + str(ws.e(0)))
Output:
The X values are: [0. 1. 2. 3. 4. 5. 6. 7. 8. 9.]
The Y values are: [ 2.  3.  4.  5.  6.  7.  8.  9. 10.]
The updated Error values are: [3.         3.16227766 3.60555128 4.24264069 5.         5.83095189
 6.70820393 7.61577311 8.54400375]
Example - Plus as an operator
# create histogram workspaces
dataX1 = [0,1,2,3,4,5,6,7,8,9] # or use dataX1=range(0,10)
dataY1 = [0,1,2,3,4,5,6,7,8] # or use dataY1=range(0,9)
dataE1 = [0,1,2,3,4,5,6,7,8] # or use dataE1=range(0,9)
dataX2 = [0,1,2,3,4,5,6,7,8,9] #X-values must be identical
dataY2 = [2,2,2,2,2,2,2,2,2]
dataE2 = [3,3,3,3,3,3,3,3,3]
ws1 = CreateWorkspace(dataX1, dataY1, dataE1)
ws2 = CreateWorkspace(dataX2, dataY2, dataE2)

# perform the algorithm
ws = ws1 + ws2

print("The X values are: " + str(ws.x(0)))
print("The Y values are: " + str(ws.y(0)))
print("The updated Error values are: " + str(ws.e(0)))
Output:
The X values are: [0. 1. 2. 3. 4. 5. 6. 7. 8. 9.]
The Y values are: [ 2.  3.  4.  5.  6.  7.  8.  9. 10.]
The updated Error values are: [3.         3.16227766 3.60555128 4.24264069 5.         5.83095189
 6.70820393 7.61577311 8.54400375]
Example - Addition using in-place operator
# create histogram workspaces
dataX1 = [0,1,2,3,4,5,6,7,8,9] # or use dataX1=range(0,10)
dataY1 = [0,1,2,3,4,5,6,7,8] # or use dataY1=range(0,9)
dataE1 = [0,1,2,3,4,5,6,7,8] # or use dataE1=range(0,9)
dataX2 = [0,1,2,3,4,5,6,7,8,9] #X-values must be identical
dataY2 = [2,2,2,2,2,2,2,2,2]
dataE2 = [3,3,3,3,3,3,3,3,3]
ws = CreateWorkspace(dataX1, dataY1, dataE1)
ws1 = CreateWorkspace(dataX2, dataY2, dataE2)

# perform the algorithm
ws += ws1

print("The X values are: " + str(ws.x(0)))
print("The Y values are: " + str(ws.y(0)))
print("The updated Error values are: " + str(ws.e(0)))
Output:
The X values are: [0. 1. 2. 3. 4. 5. 6. 7. 8. 9.]
The Y values are: [ 2.  3.  4.  5.  6.  7.  8.  9. 10.]
The updated Error values are: [3.         3.16227766 3.60555128 4.24264069 5.         5.83095189
 6.70820393 7.61577311 8.54400375]
Example - Add a scalar
# create histogram workspaces
dataX1 = [0,1,2,3,4,5,6,7,8,9] # or use dataX1=range(0,10)
dataY1 = [0,1,2,3,4,5,6,7,8] # or use dataY1=range(0,9)
dataE1 = [0,1,2,3,4,5,6,7,8] # or use dataE1=range(0,9)
ws1 = CreateWorkspace(dataX1, dataY1, dataE1)

# perform the algorithm
ws = ws1 + 2.5

print("The X values are: " + str(ws.x(0)))
print("The Y values are: " + str(ws.y(0)))
print("The updated Error values are: " + str(ws.e(0)))
Output:
The X values are: [0. 1. 2. 3. 4. 5. 6. 7. 8. 9.]
The Y values are: [ 2.5  3.5  4.5  5.5  6.5  7.5  8.5  9.5 10.5]
The updated Error values are: [0. 1. 2. 3. 4. 5. 6. 7. 8.]
Categories: AlgorithmIndex | Arithmetic
Source#
C++ header: Plus.h
C++ source: Plus.cpp