ALFView#
Interface Overview#
The ALF instrument requires frequent manual adjustments after each run to realign the single crystal(s). These adjustments require
us to know how much we should rotate the sample by (R). This can be calculated from the out of plane angle, V, and
two theta, 2θ, obtained from the ALFView interface.
The Out of Plane Angle is the vertical position of the detectors as viewed from the sample.
The interface can be accessed from the main menu of MantidWorkbench, in Interfaces → Direct → ALFView.
Loading Data#
The loading section is used to load a Sample dataset, and optionally a Vanadium dataset. This can be achieved by either typing the run number or browsing to the file of interest.
The Sample and Vanadium datasets are first normalised by current and then converted to units of dSpacing. The Sample is then normalised by dividing it by the Vanadium (if a Vanadium run is provided).
Note that the Sample and Vanadium x arrays must be the same for this normalisation to work.
Selecting Tubes#
The normalised data should now be plotted on a custom version of the Instrument View, which only contains the ‘Render’ and ‘Pick’ tabs.
In the ‘Pick’ tab, you have several options for selecting one or more tubes.
Tool |
Effect |
|---|---|
Select whole tube |
Select a tube by clicking on it. Click on more than one tube to select multiple. This tool remains selected until you click a different tool in the ‘Pick’ tab. |
Draw a rectangle |
Select one or more tubes by drawing a rectangular region. If any part of a tube, no matter how small, is contained within the region, it is selected. The Edit Shape tool is selected after this has been used. |
Edit a shape |
Allows you to select a shape drawn on the plot so you can
move, resize or delete it. Use the |
The following keyboard shortcuts are available when a shape is selected.
Shortcut |
Action |
|---|---|
|
Copies the selected shape(s) |
|
Pastes the selected shape(s) |
|
Deletes the selected shape(s) |
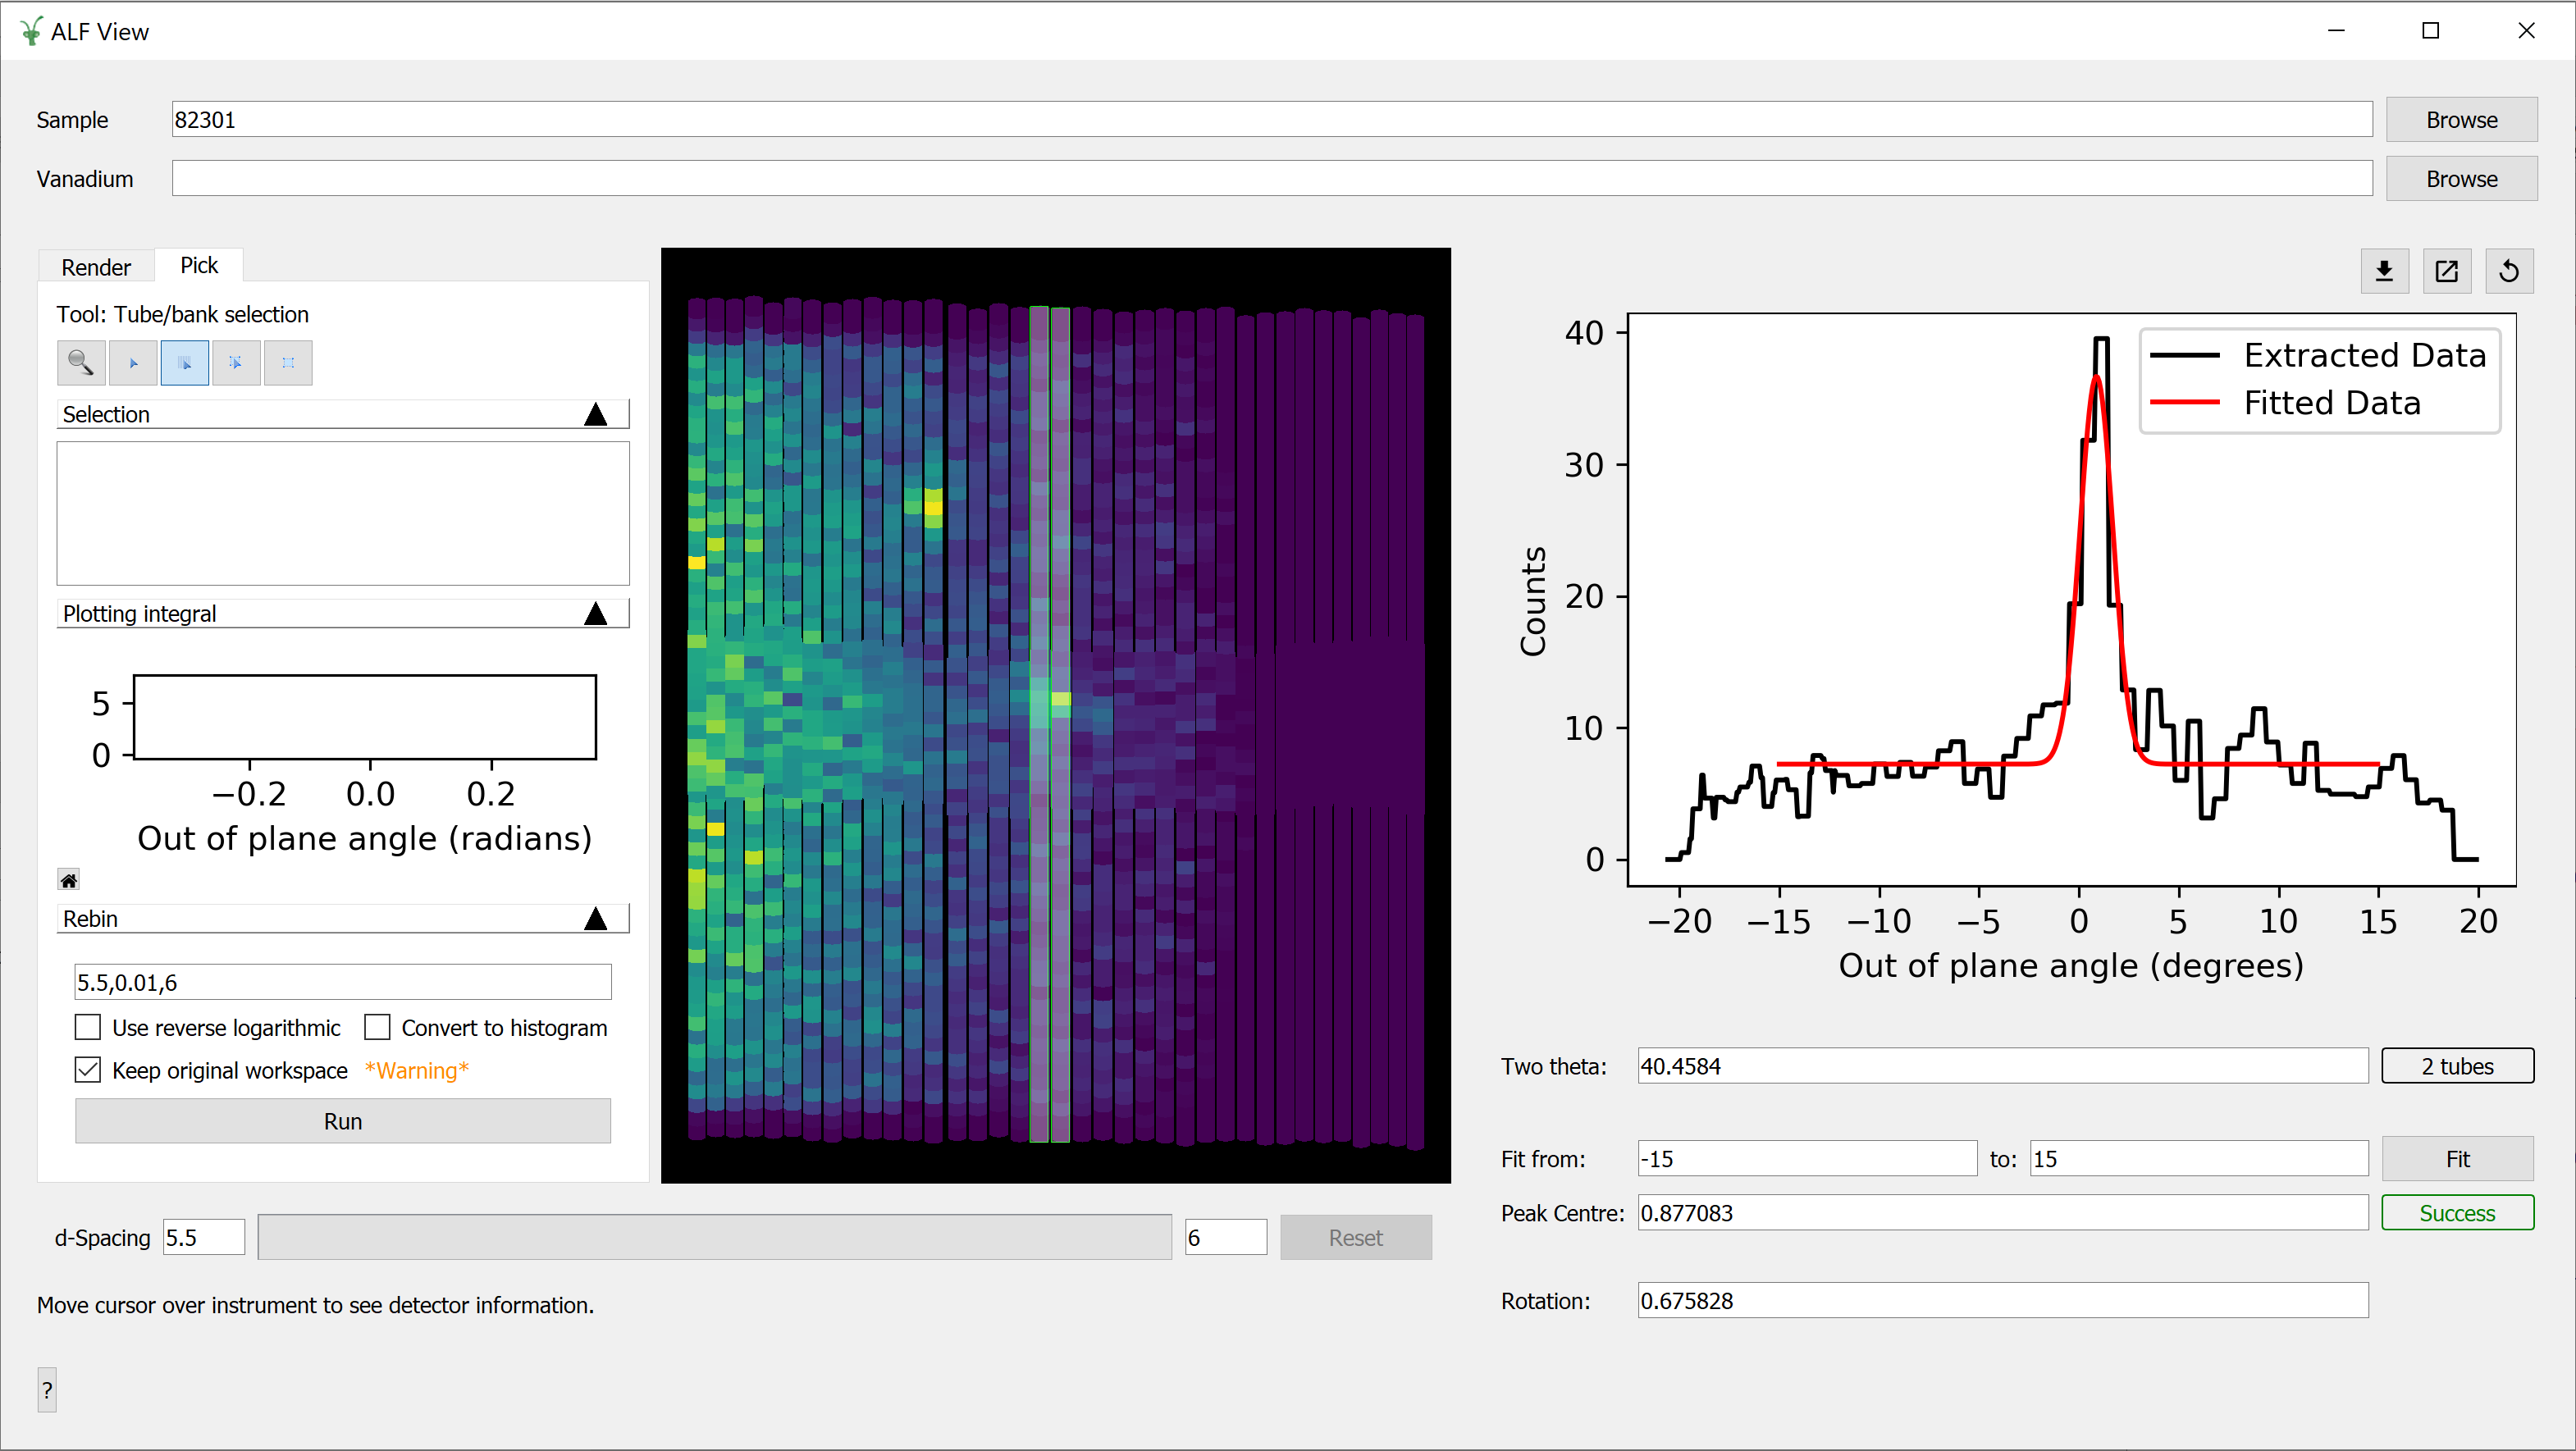
Once you have selected a tube, a plot of the out of plane angle vs counts is plotted on the right hand side of the interface.
Calculating Rotation#
At the top of the right hand pane is a preview plot showing the out of plane angle vs counts for the selected tubes. A Fit of a Flat Background + Gaussian composite function is required to determine the centre of the peak on this plot.
Above the plot are several options which are not necessary for the main workflow.
Option |
Description |
|---|---|
|
This option will export the data displayed on the plot to a workspace named ‘ALFView_exported’. |
|
This option will open the plot in a separate window. This provides more plotting options. |
|
This option will remove the Fit on the plot and reset the peak centre and rotation angle. |
 Generate workspace from plot
 Open plot in new window
 Reset extracted plot
Underneath the plot are the following values.
Value |
Description |
|---|---|
Two theta, |
The average two theta of the extracted tubes, in degrees. The two theta of a tube is taken to be the two theta at which the out of plane angle is closest to zero. |
Fit range |
The range within which the fit should be performed, in degrees. |
Peak centre, |
The centre of a Flat Background + Gaussian composite function, in degrees. |
Rotation angle, |
The rotation angle defined by the equation above, in units of degrees. |
Click on the Fit button to find a value for the peak centre. Repeated Fits will attempt to refine the Peak Centre value further. The resulting fit is added to the preview plot.
The Rotation angle, R, will also be calculated automatically in units of degrees.
Categories: Interfaces | Direct