Sample Logs#
Basic Inspection#
When experiments are run, experimental information is saved as Sample Logs. They are simply a record of certain quantities over time, e.g. SampleTemp.
To access these:
Load data with logs attached (e.g.
CNCS_7860_event.nxs)Right-click on the workspace in the Workspace Toolbox and select “Show Sample Logs”.
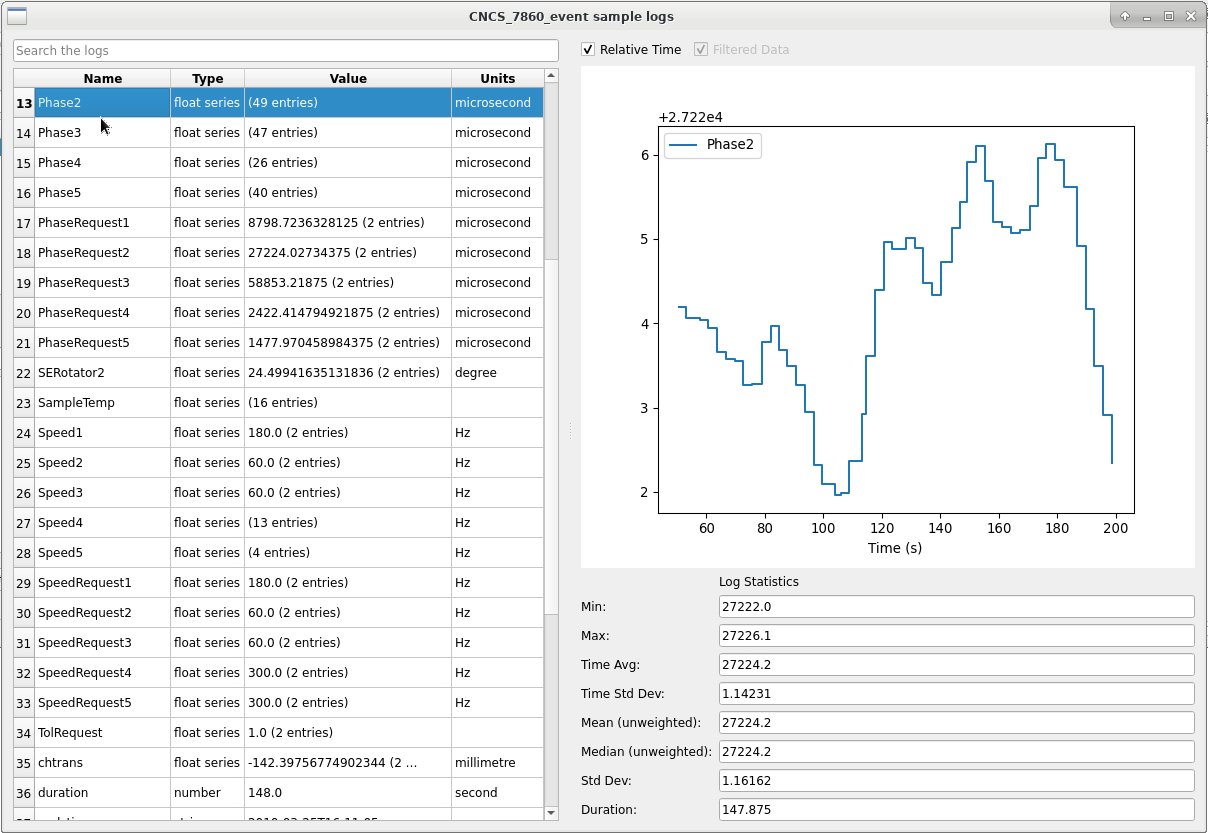
Move through the logs with arrow keys or by scrolling and clicking on the log of interest. The plot will update for relevant logs.
Use the Relative Time tickbox to change time between absolute (experiment timestamp) and relative (normal time axis).
Right-clicking on a log (e.g. SampleTemp) you can produce a normal workbench plot of the selected log, or print its values to the Messages Box:
# SampleTemp
2010-Mar-25 16:09:27.620000000  279.904
2010-Mar-25 16:09:31.511000032  279.907
2010-Mar-25 16:09:41.510999794  279.909
2010-Mar-25 16:09:51.526000137  279.913
2010-Mar-25 16:10:01.542000885  279.917
2010-Mar-25 16:10:11.542000885  279.921
2010-Mar-25 16:10:21.542000885  279.926
2010-Mar-25 16:10:31.557999725  279.932
2010-Mar-25 16:10:41.558003540  279.938
2010-Mar-25 16:10:51.558003540  279.943
2010-Mar-25 16:11:01.558003540  279.95
2010-Mar-25 16:11:11.558003540  279.957
2010-Mar-25 16:11:21.558003540  279.965
2010-Mar-25 16:11:31.558003540  279.972
2010-Mar-25 16:11:41.558003540  279.98
2010-Mar-25 16:11:51.558003540  279.987
For more info, check out how to access Sample logs with Python.
Filtering#
As sample logs are recorded with timestamps, event data (where each neutron timestamp is recorded) can be filtered into time intervals based on these sample logs.
As well as the info below, you may find our Overview of Event Filtering helpful.
Algorithms#
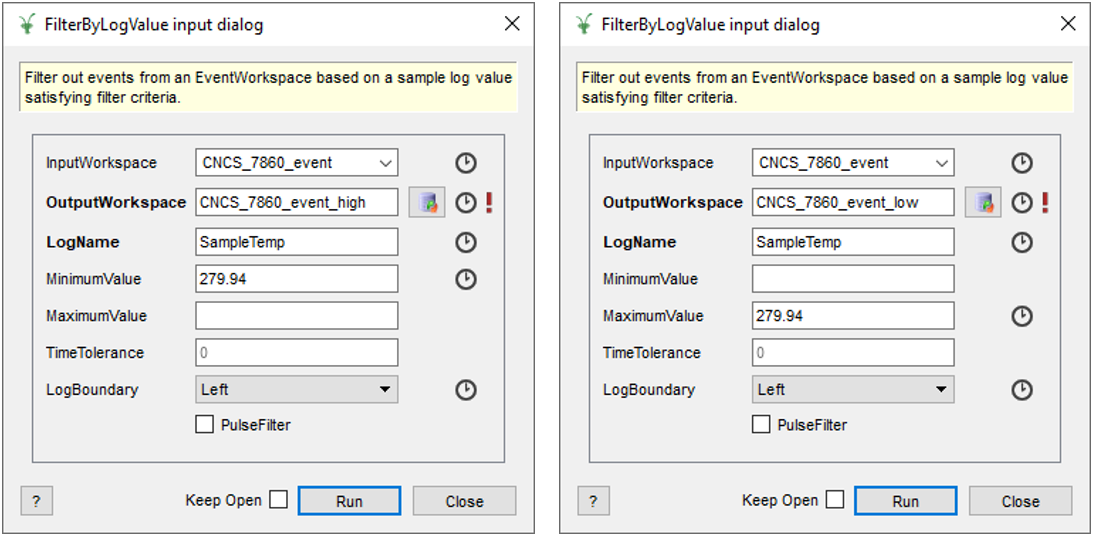
This can be performed directly with FilterByTime v1 or indirectly with FilterByLogValue v1:
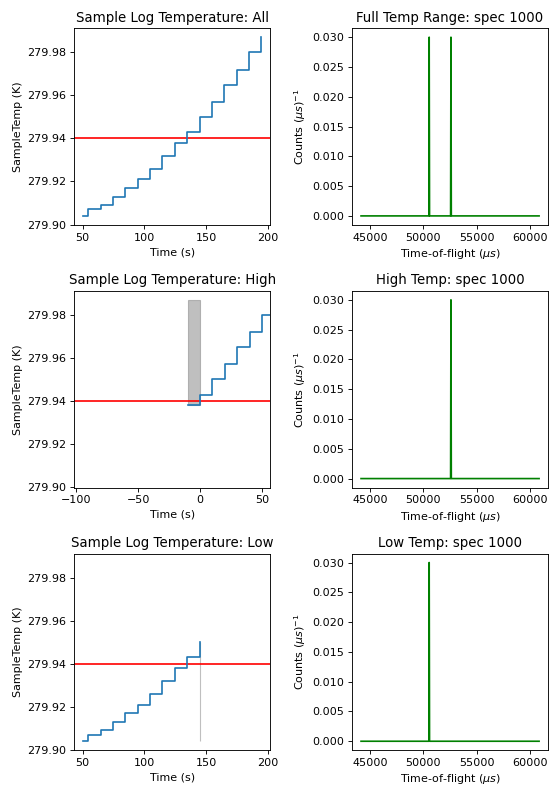
Using the input parameters specified below, the CNCS_7860_event workspace can be filtered by the log value -
SampleTemp.
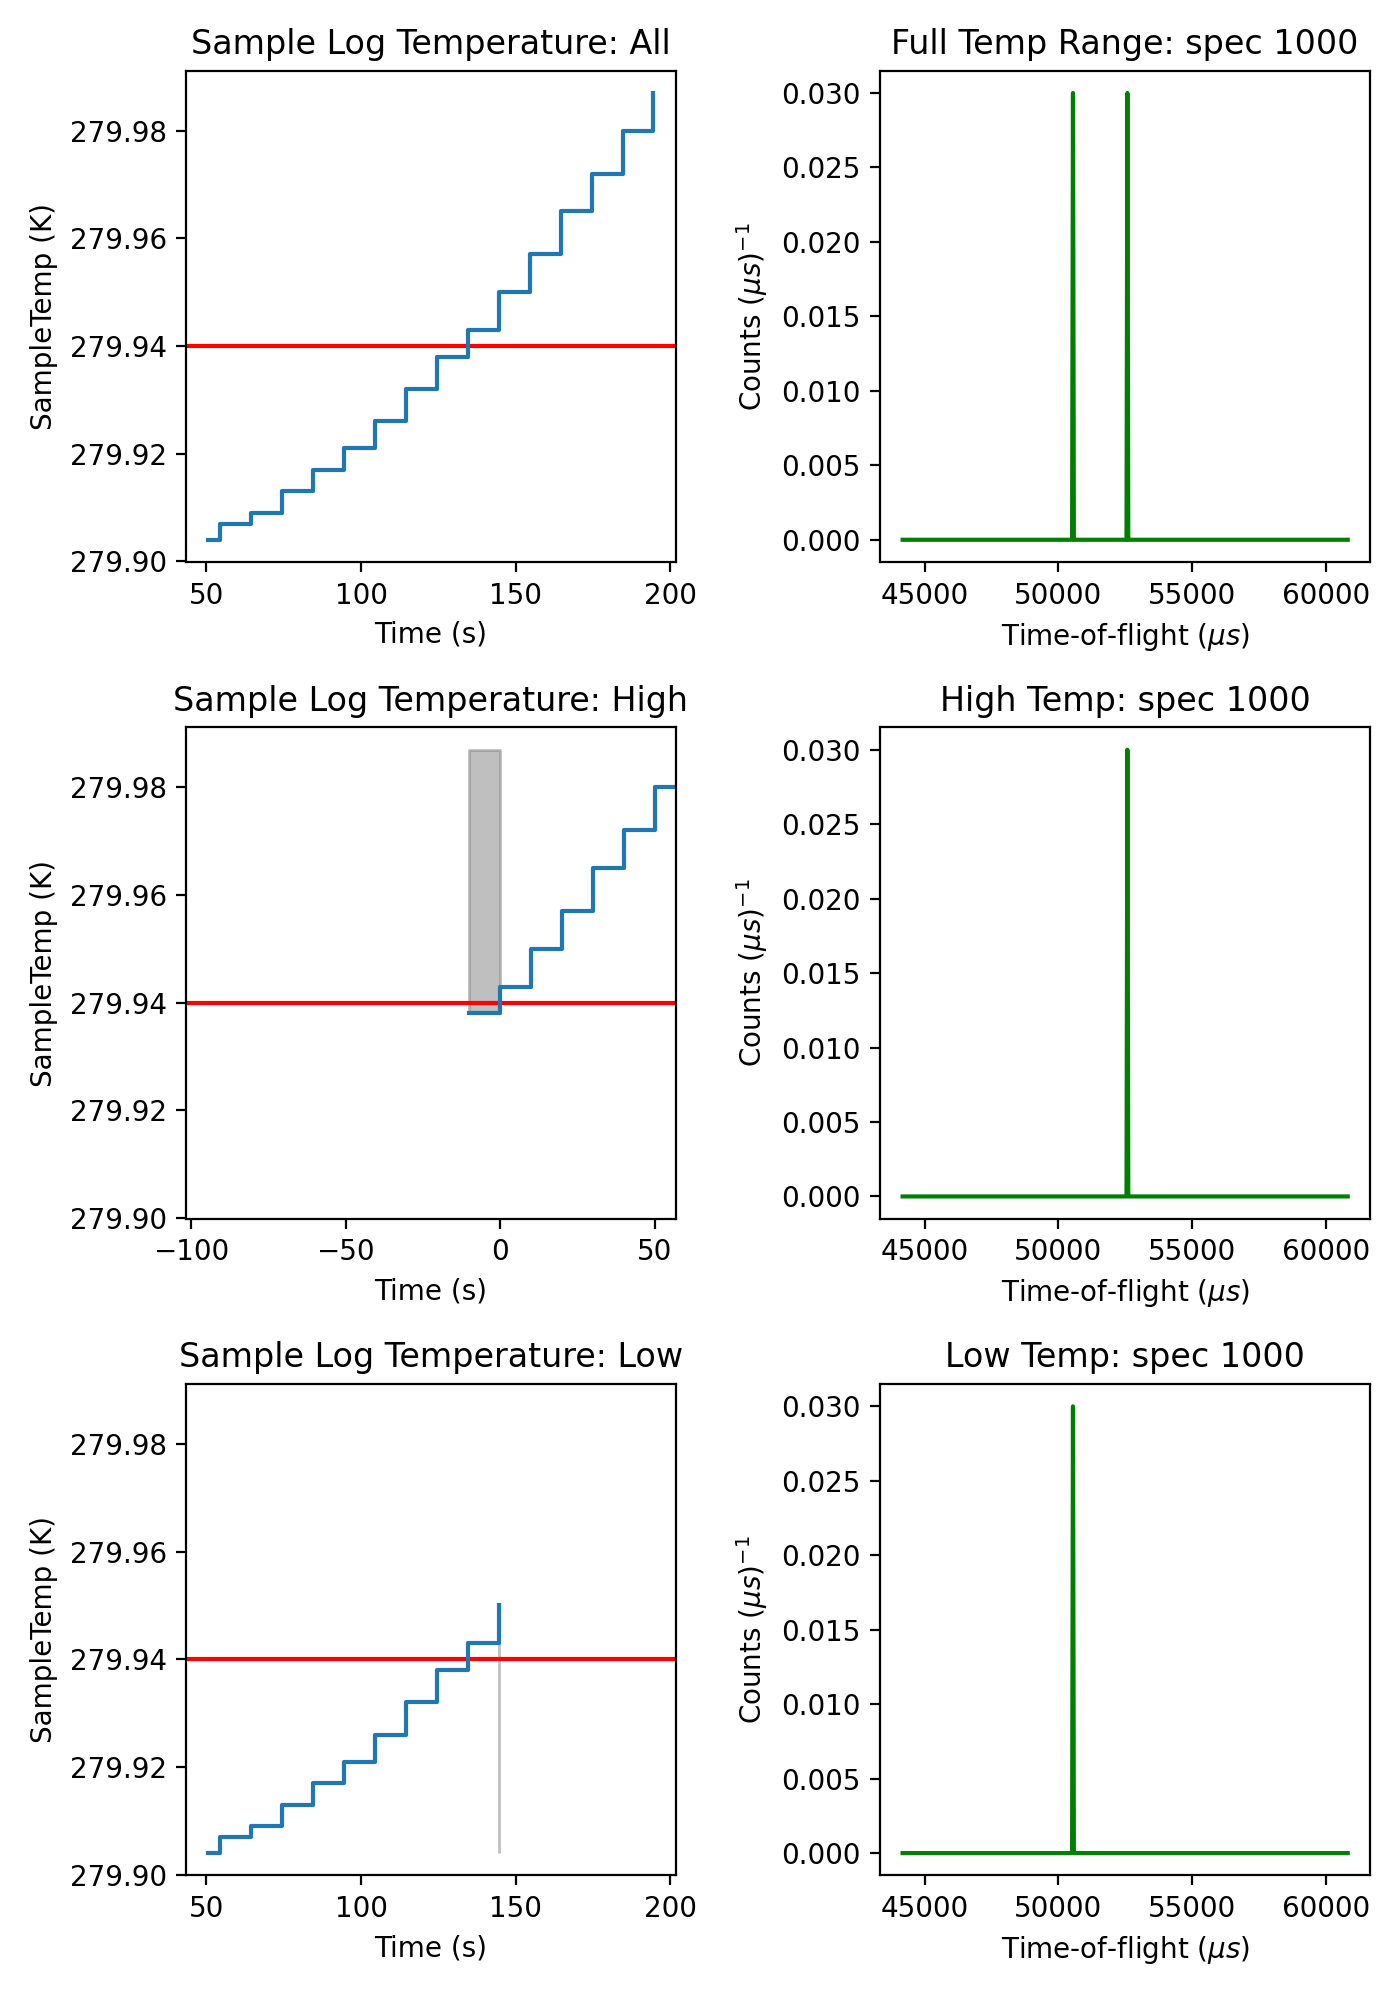
Look at the effect this filter has on the SampleTemp log and in particular on the data in spectrum number 1000. Note that the time for the high temperature sample log data has reset its minimum value to 0 as it doesn’t have the start time value needed to calculate the relative time (the start of the logs here is where we made the cut).
(Source code, png, hires.png, pdf)
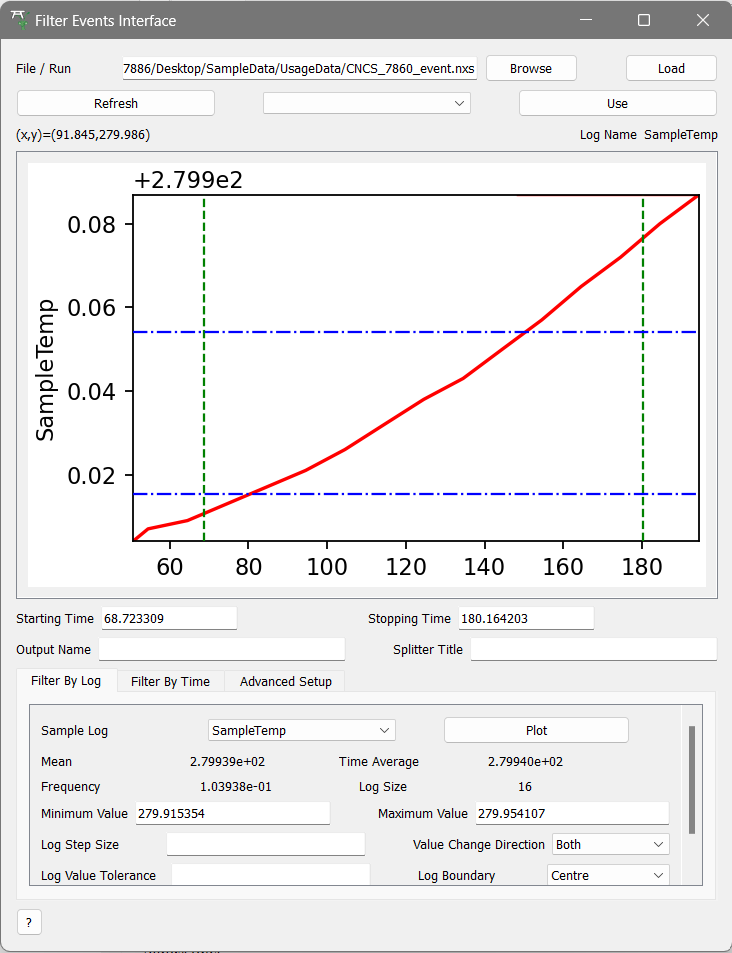
Interface#
There is also an interface for FilteringEvents. From the top menu bar select Interface > Utility > FilterEvents.
This is a more interactive way of filtering data. A few differences from the “Show Sample Logs” interface are that logs
are not plotted with a step drawstyle and a normal workbench plot cannot be created.
In the same way as above you can select the sample log of interest and set a Min/Max value. When you click ‘Filter’ the following workspaces will be outputted to the Workspace Toolbox: a TableWorkspace, which can be used as a SplitterWorkspace (an outline of where to apply the filter), and a WorkspaceGroup containing the filtered and unfiltered data.
For more information on the other functionalities of this interface see: Filter Events Interface.