Invalid Sample Logs#
Sample logs can be marked as invalid when measured. This is simply a mark that there is not full confidence in this sample log.
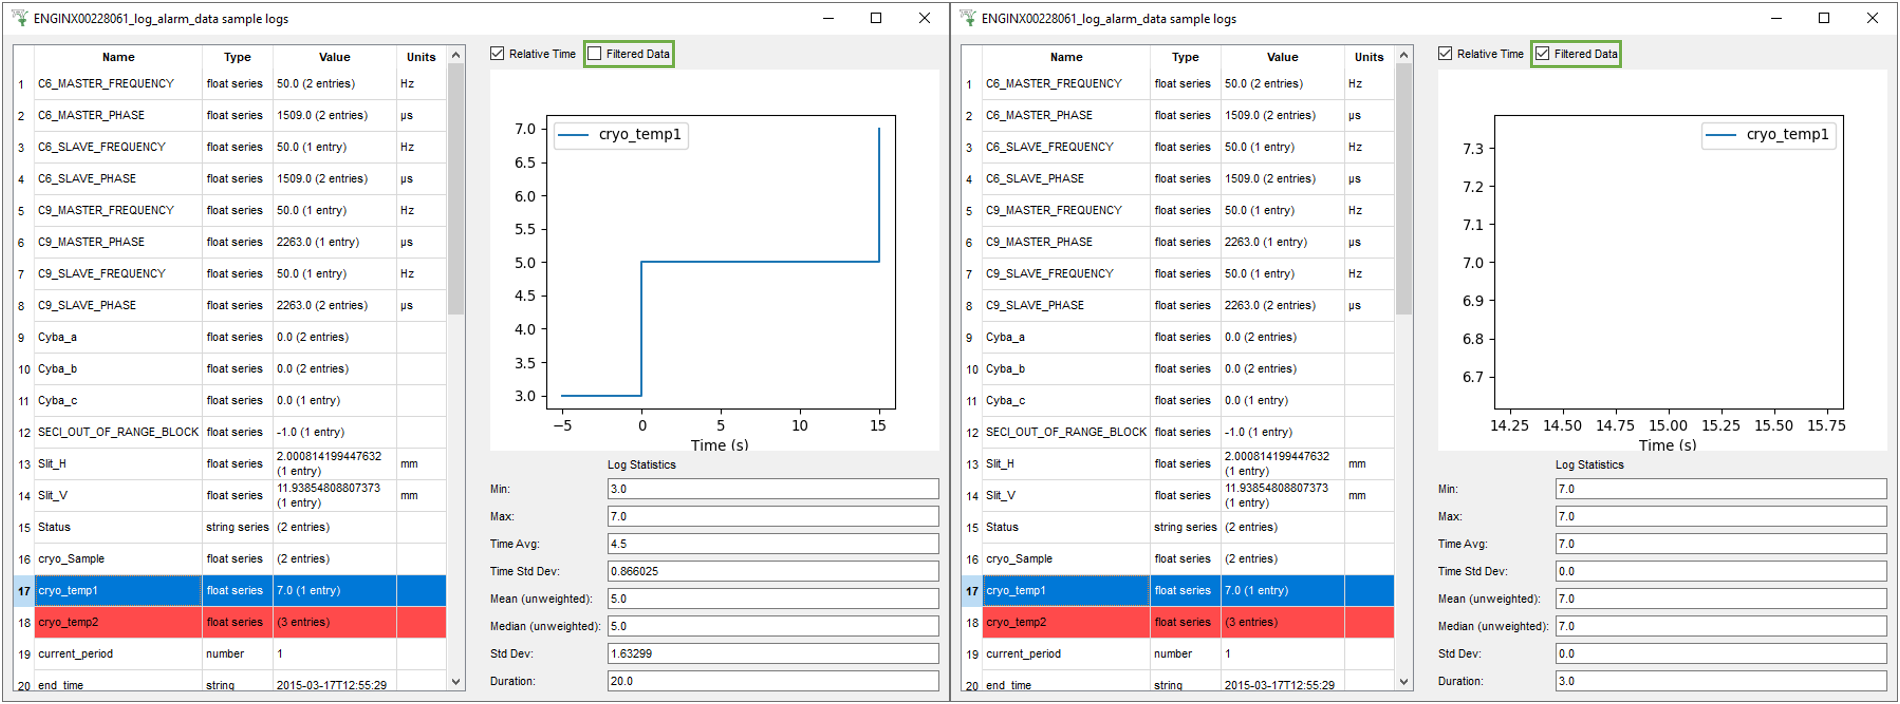
Logs that only include invalid entries are displayed as red in the Sample Logs table. These entries are not filtered.
Logs that have some invalid and some good entries are displayed in a shade of pink, where redder shades indicate a greater percentage of invalid values. The entries in this partially invalid logs are filtered (to remove invalid entries and any entries measured outside of the time interval defined by the run status).
The plot, which displays relevant sample logs, can be changed to show the filtered and unfiltered entries by toggling the Filtered tickbox at the top of the Sample Logs interface.
e.g. ENGINX00228061_log_alarm_data.nxs
Fully Invalid
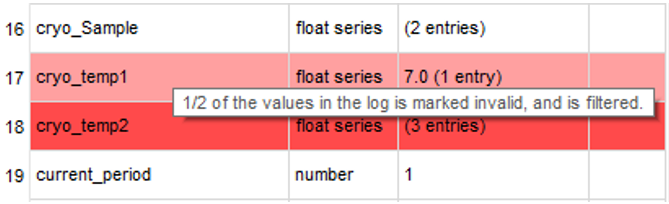
cryo_temp2 (3 entries)All of the values in the log are marked invalid, none of them are filtered.Partially invalid
cryo_temp1 7.0 (1 entry)1/2 of the values in the log is marked invalid, and is filtered.
For cryo_temp1 unfiltered there are 3 entries [3.0,5.0,7.0]. The first value [3.0] was recorded at
negative relative time, before the Status sample log was marked as RUNNING, so it was filtered out.
Then, as mentioned in the tooltip in the image above, 1 of the 2 entries that occurred during run time,
was invalid at [5.0]. When filtered, this leaves one valid entry [7.0], which is focussed on in the Filtered
plot and the filtered statistics.
# cryo_temp1
2015-Mar-17 12:55:12  3
2015-Mar-17 12:55:17  5
2015-Mar-17 12:55:32  7

# Status
2015-Mar-17 12:55:11  SETUP
2015-Mar-17 12:55:17  RUNNING
To learn more about accessing sample logs in Python, including invalid logs, see: Run Info and Sample Logs.