\(\renewcommand\AA{\unicode{x212B}}\)
Viewing Data
Workspace Toolbox
Mantid Workbench needs a way of storing the data it loads into something. These ‘somethings’ are called workspaces. You can see all of the Workspaces that Mantid has loaded in the Workspaces toolbox, together with buttons to Load, Delete, Group (changes to Ungroup if already Grouped), Sort and Save Workspaces. There is also a search bar to filter by name.
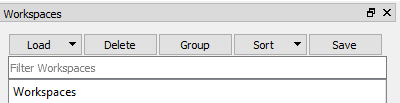
Next to each workspace is a little triangle you can click to view a few more details about the workspace.
Workspace Matrix View - Show Data
The dialog below is the workspace matrix view, and can be used to look at histogram or event data. To create one, right-click the workspace name and select “Show Data”.
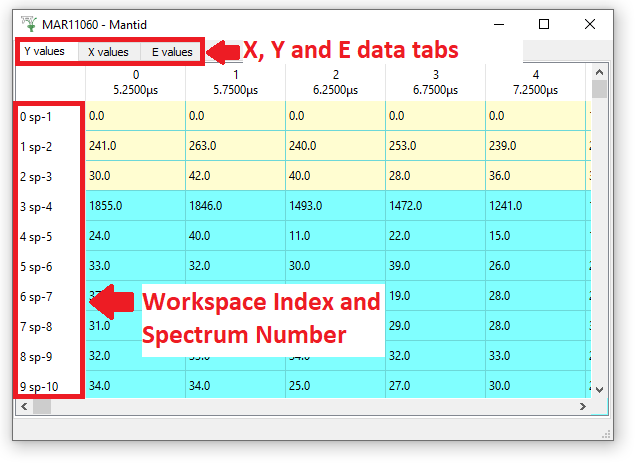
Normal Data is displayed with a light blue background. Spectra that correspond to monitor detectors appear as the first rows and are marked with a light yellow background. A monitor is a low efficiency detector of the particle beam, that can be placed before and after the sample, that can be used for normalisation. The rows corresponding to the masked detectors (if present) will be highlighted with a light grey background. If a monitor spectrum itself is masked, it will be marked with light grey just as other masked spectra. Masked bins will also be marked with light grey, except for EventWorkspaces (we will return to this later).
Each row in the matrix shows data values of a single spectra. By flipping between the tabs you can see the X, Y and E values.
“Y values”” contains the counts found in each bin of the spectrum.
“X values” contains the Bin boundaries or Bin centres of the X axis. If they are bin Boundaries you will have one more column in the X tab than you do in the Y or E tabs.
“E contains” the errors associated with the counts. For most raw data this will initially be the square root of Y on loading.
The Index number refers to the bin it relates to. On the “Y values” and “E values” tabs there is another number (above displayed with the unit ‘μs’).
The first number at the left of each row we call the “Workspace Index” and is simply the row number as data is read into the workspace; in the same way as a spreadsheet program like Excel uses row numbers. This always starts from zero, but the corresponding Spectrum Number is displayed as ‘sp 1’. Often it is the case that the Spectrum Number is one greater than the Workspace Index, but this is not always the case. If you only load part of a file, for example spectra 100 - 200, then the Workspace Indices will still be 0-100, but Mantid will remember the original Spectra Number of each spectrum.
Linking Workspace Index to Detector IDs
The data in each spectrum can come from one or more detectors. You can get spectra linked to multiple detectors either by hardware detector grouping or by grouping the detectors in Mantid. To see the Detector table right-click on the workspace name and select “Show Detectors”.
This table contains Workspace Indices, Spectrum Numbers, Detector IDs and locations of the detectors, together with a flag showing which are monitors. If a spectrum contains a group of detectors then the position shown will be the average position of those detectors.
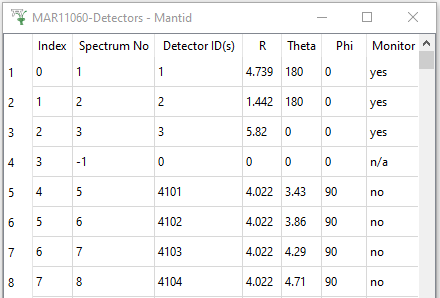
In the example above, the first three spectra correspond to data from monitors. The fourth spectrum (with a Spectrum Number of -1) loaded from the MAR11060 run is for some reason not present in the Instrument definition, and the remaining rows that are visible show histograms wired up to detectors with spectrum number 5-7 or equivalently detectors with IDs of 4101-3.