Displaying 1D Data#
The Simplest Plot#
Load “MAR11060”.
Right click the workspace in the workspace list.
Select “Plot > Spectrum …”.
In the dialog that appears enter “1-3” in the spectra number box.
Click “OK”.
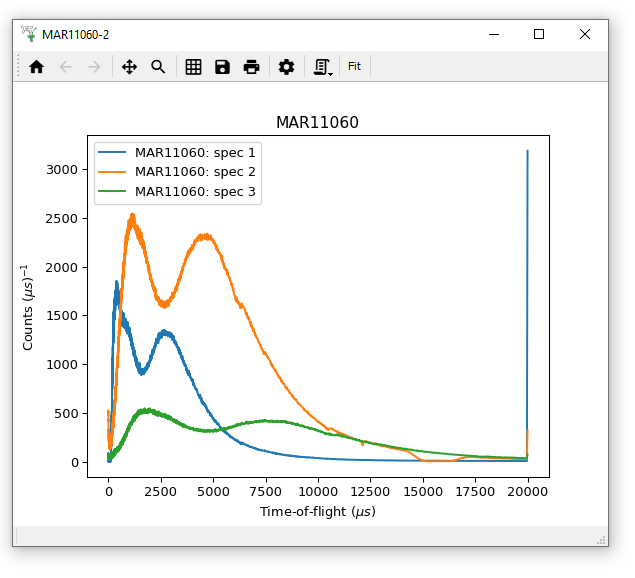
You should get a plot like this with three spectra corresponding to spectra 1-3 (which in this case these are the monitors on MARI):
Another way to plot#
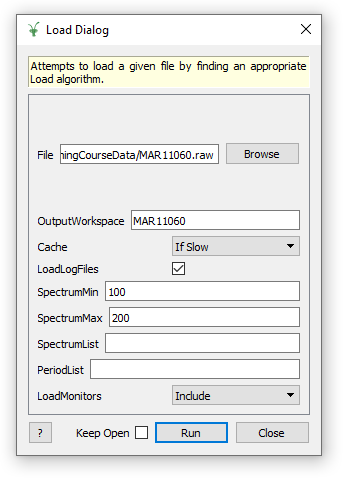
Load MAR11060.raw, but this time set SpectrumMin to be “100” and SpectrumMax to be “200”. Because the values are inclusive, we are actually loading 101 spectra, starting at 100.
Display the matrix window to view the data.
Select multiple rows using one of the following methods:
Click the first index label, and then hold shift while selecting the last.
Click and drag down the index labels to select as many as you want.
Click while holding Ctrl to select / deselect individual rows.
Please highlight rows 0-2 and bring up the following right-click menu. Select
Plot spectrum (values only).
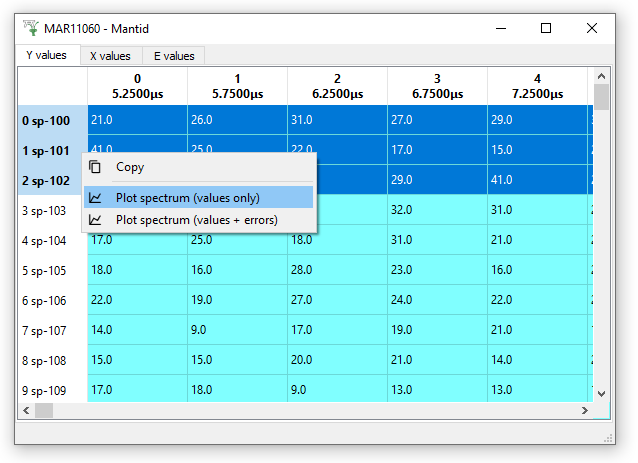
You will be presented with options for plotting the selected spectra, with and without errors. Select “Plot Spectra” (showing the values only):
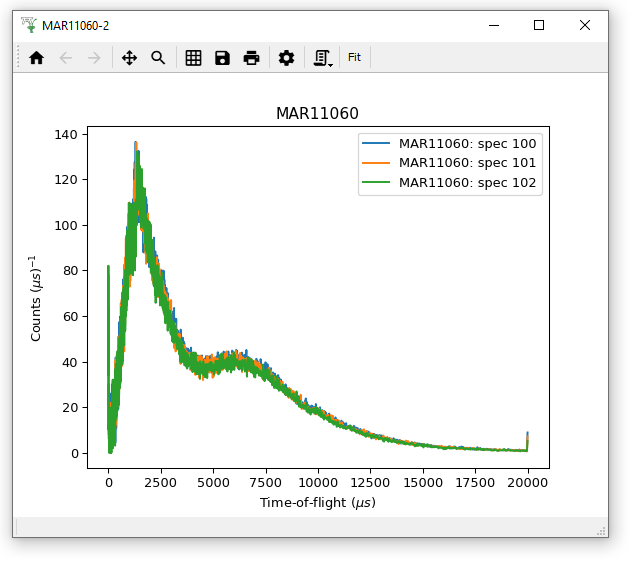
Notice the legend entries “MAR11060: spec 100”, …, “MAR11060: spec 102”, where “spec” is shorthand for Spectrum Number.
Adding a curve to an existing plot#
There are two ways to add spectra to an already existing graph, either from the same workspace or from another.
Drag the Workspace from the Workspace List and drop it onto the graph you want to add the curve to.
Right-click the Workspace from the Workspace list and Select “Plot > Overplot spectrum …”. This will attach your additional spectra to your last active plot.
In both cases, if the Workspace contains more than one spectra you will be asked which spectra you wish to add to the plot.