Advanced Plotting#
For a Simple, Waterfall or Tiled 1D plot, you right-click on the Workspace and select “Plot > Spectrum…”. The short-cut to this is to just double-click on the Workspace!
Waterfall Plot#
Waterfall plots are a useful tools for comparing different, but maybe similar, spectra.
Load the file “EMU00020884.nxs”
Open the Plot Spectrum dialog with either method above
For “Spectrum Numbers”, enter “5-10”
Change the “Plot Type” to “Waterfall Plot”
Press OK
Then one gets (after clicking the home button to rescale the axes):
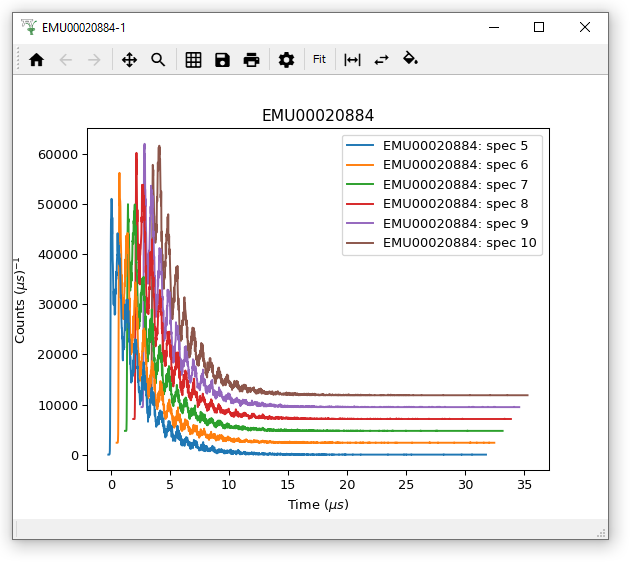
In the plot window Toolbar, the three buttons to the right allow you to change the offset between the curves, reverse the order of the curves and fill in the area under a curve. if you’re ever unsure what one of these buttons is for, hover your mouse over it for a tool-tip!
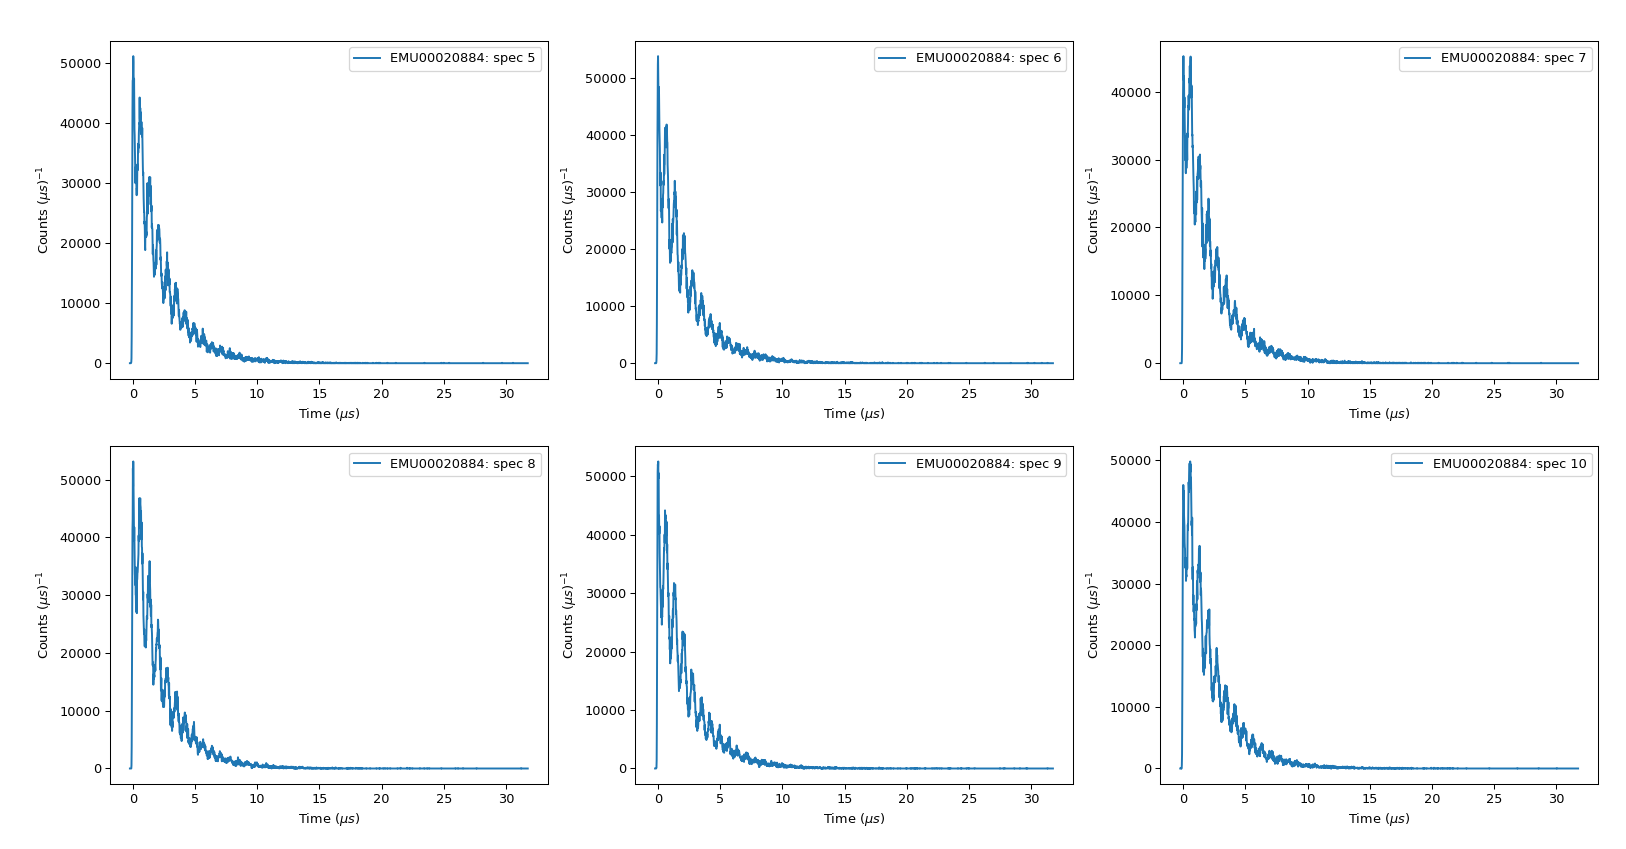
Tiled Plots#
Tiled Plots can be done in a similar manner to Waterfall plots, but with the appropriate choice of “Plot Type”. If you produce a Tiled plot with more than about 4 tiles, you may need to enlarge plot window or set it to full screen to appreciate all of the spectra.