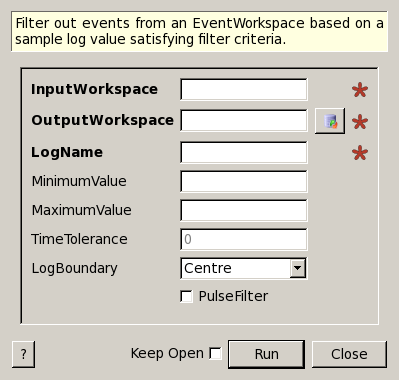
FilterByLogValue dialog.
Table of Contents
Filter out events from an EventWorkspace based on a sample log value satisfying filter criteria.
| Name | Direction | Type | Default | Description |
|---|---|---|---|---|
| InputWorkspace | Input | EventWorkspace | Mandatory | An input event workspace |
| OutputWorkspace | Output | EventWorkspace | The name to use for the output workspace | |
| LogName | Input | string | Mandatory | Name of the sample log to use to filter. For example, the pulse charge is recorded in ‘ProtonCharge’. |
| MinimumValue | Input | number | Optional | Minimum log value for which to keep events. |
| MaximumValue | Input | number | Optional | Maximum log value for which to keep events. |
| TimeTolerance | Input | number | 0 | Tolerance, in seconds, for the event times to keep. A good value is 1/2 your measurement interval. For a single log value at time T, all events between T+-Tolerance are kept. If there are several consecutive log values matching the filter, events between T1-Tolerance and T2+Tolerance are kept. |
| LogBoundary | Input | string | Centre | How to treat log values as being measured in the centre of the time, or beginning (left) boundary. Allowed values: [‘Centre’, ‘Left’] |
| PulseFilter | Input | boolean | False | Optional. Filter out a notch of time for each entry in the sample log named. A notch of width 2*TimeTolerance is centered at each log time. The value of the log is NOT used.This is used, for example, to filter out veto pulses. |
Filters out events using the entries in the Sample Logs.
Sample logs consist of a series of pairs. The first step in filtering is to generate a list of start-stop time intervals that will be kept, using those logs.
There is no interpolation of log values between the discrete sample log times at this time. However, the log value is assumed to be constant at times before its first point and after its last. For example, if the first temperature measurement was at time=10 seconds and a temperature within the acceptable range, then all events between 0 and 10 seconds will be included also. If a log has a single point in time, then that log value is assumed to be constant for all time and if it falls within the range, then all events will be kept.
If you select PulseFilter, then events will be filtered OUT in notches around each time in the selected sample log, and the MinValue/MaxValue parameters are ignored. For example:
The typical use for this is to filter out “veto” pulses from a SNS event nexus file. Some of these files have a sample log called “veto_pulse_time” that only contains times of the pulses to be rejected. For example, this call will filter out veto pulses:
ws = FilterByLogValue(ws, LogName="veto_pulse_time", PulseFilter="1")
Wiki page EventFiltering has a detailed introduction on event filtering in MantidPlot.
Example - Filtering by a simple time series Log
ws = CreateSampleWorkspace("Event",BankPixelWidth=1)

AddTimeSeriesLog(ws, Name="proton_charge", Time="2010-01-01T00:00:00", Value=100)
AddTimeSeriesLog(ws, Name="proton_charge", Time="2010-01-01T00:10:00", Value=100)
AddTimeSeriesLog(ws, Name="proton_charge", Time="2010-01-01T00:20:00", Value=100)
AddTimeSeriesLog(ws, Name="proton_charge", Time="2010-01-01T00:30:00", Value=100)
AddTimeSeriesLog(ws, Name="proton_charge", Time="2010-01-01T00:40:00", Value=15)
AddTimeSeriesLog(ws, Name="proton_charge", Time="2010-01-01T00:50:00", Value=100)

print "The unfiltered workspace %s has %i events and a peak value of %.2f" % (ws, ws.getNumberEvents(),ws.readY(0)[50])

wsOut = FilterByLogValue(ws,"proton_charge",MinimumValue=75, MaximumValue=150)

print "The filtered workspace %s has %i events and a peak value of %.2f" % (wsOut, wsOut.getNumberEvents(),wsOut.readY(0)[50])
Output:
The unfiltered workspace ws has 1900 events and a peak value of 257.00
The filtered workspace wsOut has 950 events and a peak value of 131.00
Categories: Algorithms | Events\EventFiltering