Table of Contents
DrILL stands for Data Reduction at ILL. It provides an easy to use interface for the reduction of data measured on different ILL instruments. Here are the currently supported instruments:
- D11: SANS
- D16: SANS
- D17: Reflectometry
- D22: SANS
- D33: SANS
- FIGARO: Reflectometry
The interface is accessible through the Workbench menu bar: Interfaces -> ILL -> DrILL.
n.b. To be able to use the interface, one has to set the default facility to ILL first. Open the settings through the workbench menu (File -> Settings). In the General tab, set the facility to ILL.
The DrILL main window is composed of different parts:
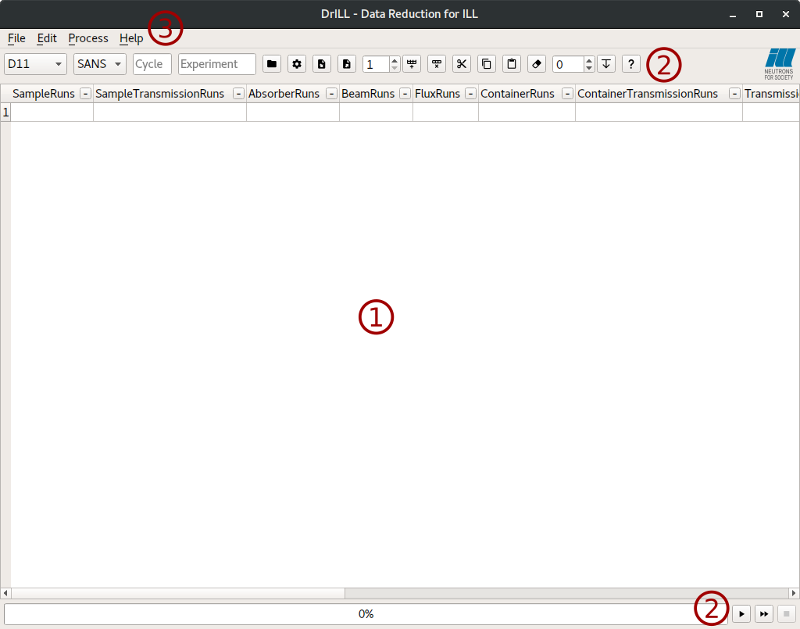
A global settings dialog is also accessible through the menu or its dedicated tool button. This dialog contains more options for the reduction algorithm.
The underlying data reduction algorithm depends on the experimental technique. Its selection is triggered when one has selected the instrument and the acquisition mode.
To get further information on the currently supported algorithms:
- SANS: SANSILLAutoProcess
- Reflectometry: ReflectometryILLAutoProcess
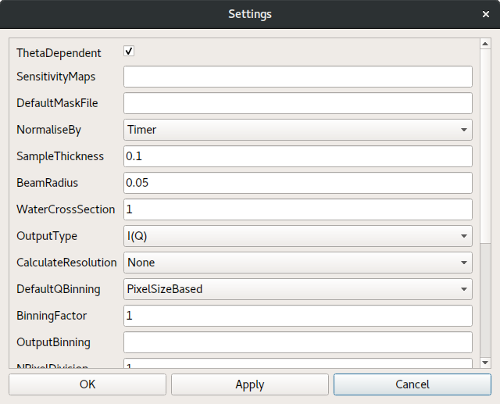
Global settings are grouped in a dedicated dialog. This dialog is accessible in the DrILL menu (File -> Settings) or with the dedicated tool button. This dialog is dynamically linked to the selected algorithm, therefore to the instrument and acquisition mode. It contains a set of options that will be used for all the samples.
When opening the dialog for the first time, the settings are set to their default value (see the corresponding algorithm documentation). After modifying the settings, one can save or discard them with the usual three buttons ‘ok’, ‘apply’ or ‘cancel’.
Each time a setting is changed in the dialog, its value is checked. A wrong value will turn red the corresponding field. A tooltip explaining the error is displayed when the mouse is over that red field. A single red field prevents the settings from being saved.
When selecting the instrument and the acquisition mode, the table is updated with the needed column headers. To obtain information about a column, a tooltip is displayed when moving the mouse over the corresponding header.
Each cell can be edited manually or filled programmatically by using some of the tool buttons.
For all algorithms, the last column of the table is always labelled
CustomOptions. It makes it possible to override a global parameter for
the current row only. It should contain a semicolon separated list of key value
pairs. For example, one can set SampleThickness=0.2;ThetaDependant=False
and override the global values of these parameters for that specific row.
When filling the table, all parameters (including the custom options) are checked for validity. When a value is not valid, the cell turns red and a tooltip (visible when the mouse moves over the cell) explains the error. A single red cell prevent the processing of the concerned row.
Processing control is made through the menu (Process) or the tool buttons at the bottom of the table. One can start the processing (of selected or all row(s)) or abort a running processing.
During processing, the table is in read-only mode. The active row(s) turn yellow, the processed ones turn green and the row(s) for which the processing failed turn red. The progress bar is also updated.
At the end of the processing, if any error occurs, a popup lists the concerned row(s). To get further information about the errors, one has to look into the Mantid logs.
Rundex file (*.mrd) is a human readable text file that represents the state of the interface in JSON format. By using the appropriate tool button or the menu bar (File -> Save… or Load…) one can export or import a Rundex file.
When saving, the global settings, all the samples and some of the visual setup are exported in the rundex file. Symmetrically, the load action imports all these data in the current DrILL session.
Category: Interfaces