\(\renewcommand\AA{\unicode{x212B}}\)
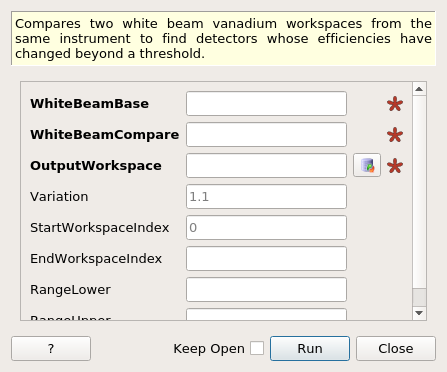
DetectorEfficiencyVariation dialog.
Table of Contents
Compares two white beam vanadium workspaces from the same instrument to find detectors whose efficiencies have changed beyond a threshold.
| Name | Direction | Type | Default | Description |
|---|---|---|---|---|
| WhiteBeamBase | Input | MatrixWorkspace | Mandatory | Name of a white beam vanadium workspace |
| WhiteBeamCompare | Input | MatrixWorkspace | Mandatory | Name of a matching second white beam vanadium run from the same instrument |
| OutputWorkspace | Output | MatrixWorkspace | Mandatory | A MaskWorkpace where each spectra that failed the test is masked. Each histogram from the input workspace maps to a histogram in this workspace with one value that indicates if there was a dead detector. |
| Variation | Input | number | 1.1 | Identify histograms whose total number of counts has changed by more than this factor of the median change between the two input workspaces. |
| StartWorkspaceIndex | Input | number | 0 | The index number of the first spectrum to include in the calculation (default: 0) |
| EndWorkspaceIndex | Input | number | Optional | The index number of the last spectrum to include in the calculation (default: the last spectrum in the workspace) |
| RangeLower | Input | number | Optional | No bin with a boundary at an x value less than this will be included in the summation used to decide if a detector is ‘bad’ (default: the start of each histogram) |
| RangeUpper | Input | number | Optional | No bin with a boundary at an x value higher than this value will be included in the summation used to decide if a detector is ‘bad’ (default: the end of each histogram) |
| NumberOfFailures | Output | number |
It is intended that the input white beam vanadium workspaces are from the same instrument and were collected before and after an experimental run of interest. First the ratios of the total number of counts in corresponding histograms from each input workspace are calculated and then the median ratio is calculated. Each ratio is compared to the median and a histogram will fail when any of the following conditions are true:
where sum1 is the sum of the counts in a histogram in the workspace WhiteBeamBase and sum2 is the sum of the counts in the equivalent histogram in WhiteBeamCompare. The above equations only make sense for identifying bad detectors if Variation > 1. If a value of less than one is given for Variation then Variation will be set to the reciprocal.
The output workspace contains a MaskWorkspace where those spectra that fail the tests are masked and those that pass them are assigned a single positive value.
Uses the Integration v1 algorithm to sum the spectra.
Example:
import numpy as np

wsBase=CreateSampleWorkspace()
ws=CreateSampleWorkspace()
noisyY =  np.array(ws.readY(0))
noisyY[0]=1e20
ws.setY(50,noisyY)

(wsOut, numFailures) = DetectorEfficiencyVariation(WhiteBeamBase='wsBase', WhiteBeamCompare='ws')

print("{} spectra has been masked in wsOut".format(numFailures))
Output:
1 spectra has been masked in wsOut
Categories: AlgorithmIndex | Diagnostics