\(\renewcommand\AA{\unicode{x212B}}\)
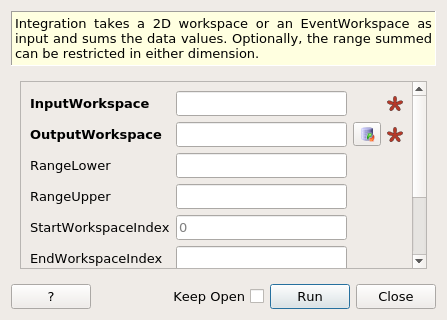
Integration dialog.
Table of Contents
Integration takes a 2D workspace or an EventWorkspace as input and sums the data values. Optionally, the range summed can be restricted in either dimension.
| Name | Direction | Type | Default | Description |
|---|---|---|---|---|
| InputWorkspace | Input | MatrixWorkspace | Mandatory | The input workspace to integrate. |
| OutputWorkspace | Output | MatrixWorkspace | Mandatory | The output workspace with the results of the integration. |
| RangeLower | Input | number | Optional | The lower integration limit (an X value). |
| RangeUpper | Input | number | Optional | The upper integration limit (an X value). |
| StartWorkspaceIndex | Input | number | 0 | Index of the first spectrum to integrate. |
| EndWorkspaceIndex | Input | number | Optional | Index of the last spectrum to integrate. |
| IncludePartialBins | Input | boolean | False | If true then partial bins from the beginning and end of the input range are also included in the integration. |
| RangeLowerList | Input | dbl list | A list of lower integration limits (as X values). | |
| RangeUpperList | Input | dbl list | A list of upper integration limits (as X values). |
Integration sums up spectra in a Workspace and outputs a Workspace that contains only 1 value per spectrum (i.e. the sum). The associated errors are added in quadrature. The two X values per spectrum are set to the limits of the range over which the spectrum has been integrated. By default, the entire range is integrated and all spectra are included.
If only a portion of the workspace should be integrated then the
optional parameters may be used to restrict the range.
StartWorkspaceIndex and EndWorkspaceIndex may be used to select a
contiguous range of spectra in the workspace (note that these parameters
refer to the workspace index value rather than spectrum numbers as taken
from the raw file). If only a certain range of each spectrum should be
summed then the RangeLower and RangeUpper properties, as well as their -List
versions should be used. RangeLower and RangeUpper are single values
limiting the summing range over all histograms. RangeLowerList and
RangeUpperList contain the ranges for each individual histogram. The
properties can be mixed: for instance, the histogram specific lower
integration limits can be given by RangeLowerList while all upper limits
can be set to the same value by RangeUpper. If both list and non-list versions
are given, then the range is chosen which gives stricter limits for each
histogram.
No rebinning takes place as part of this algorithm. If the integration limits given
do not coincide with a bin boundary then the behaviour depends on the IncludePartialBins
parameter. If IncludePartialBins=True then a contribution is calculated for any
bins that partially sit inside the integration limits. If IncludePartialBins=False
then the integration only includes bins that sit entirely within the integration limits.
If an integration limit is given that is beyond the X range covered by the spectrum then
the integration will proceed up to final bin boundary. The data that falls outside any
integration limits set will not contribute to the output workspace.
If an EventWorkspace is used as the input, the output will be a MatrixWorkspace. Rebin v1 is recommended if you want to keep the workspace as an EventWorkspace.
Integration for event workspaces refers to internal binning, provided by Rebin v1 or load algorithm and may ignore limits, provided as algorithm input. For example, attempt to integrate loaded ISIS event workspace in the range [18000,20000] yields workspace integrated in the range [0,200000], assuming the data were collected in the time range [0,20000]. This happens because the event data would have single histogram workspace bin in range [0,20000]. To obtain integral in the desired range, user have to Rebin v1 first, and one of the binning intervals have to start from 18000 and another (or the same) end at 20000.
Mantid workspaces store their data internally in one of two formats: as counts or as
frequencies (counts divided by bin-width). When the \(y\) values are stored as
frequencies, the workspace is called a distribution.
The algorithms ConvertToDistribution and
ConvertFromDistribution converts the internal
representation from counts to frequencies or vice versa.
The Integration algorithm will correctly deal with the data to give the total
counts as output. That is, if you integrate a distribution workspace directly or
convert it first to counts and then call Integration the output workspace will have
the same \(y\) values.
Note that the un-integrated axis (say the \(x\) axis) may still be binned, in which case the result of integrating distribution vs non-distribution data will not be equivalent. That is, integrating a distribution will create a new distribution where the internal \(y\) values represent the summed counts per \(x\)-bin-width. Whereas, integrating a non-distribution workspace will yield the same internal \(y\) values but these now represent counts (not counts per \(x\)-bin-width).
Some algorithms, such as SofQWNormalisedPolygon
or ConvertToReflectometryQ, create a special type of
Workspace2D called a RebinnedOutput workspace in which
each bin contains both a value and the fractional overlap area of the this bin over
that of the original data. There is more discussion of this in the
SofQWNormalisedPolygon documentation.
This algorithm calculates the integrated counts per spectra of a RebinnedOutput
workspace as follows:
where \(Y_i\) and \(F_i\) are the values and fractions for the \(i^{\mathrm{th}}\)
bin and the sum runs from RangeLower to RangeUpper. \(n\) is the number
of bins (or fractional bins if IncludePartialBins=True) in the range which is not NaN.
The \(1/n\) factor is needed so that the integral is correctly normalised compared to
the case when there is no fractional bins, where all \(F_i = 1\).
Example - Integration over limited number of histograms:
# Create a workspace filled with a constant value = 1.0
ws=CreateSampleWorkspace('Histogram','Flat background')
# Integrate 10 spectra over all X values
intg=Integration(ws,StartWorkspaceIndex=11,EndWorkspaceIndex=20)

# Check the result
print('The result workspace has {0} spectra'.format(intg.getNumberHistograms()))
print('Integral of spectrum 11 is {0}'.format(intg.readY(0)[0]))
print('Integral of spectrum 12 is {0}'.format(intg.readY(1)[0]))
print('Integral of spectrum 13 is {0}'.format(intg.readY(2)[0]))
print('Integration range is [ {0}, {1} ]'.format(intg.readX(0)[0], intg.readX(0)[1]))
Output:
The result workspace has 10 spectra
Integral of spectrum 11 is 100.0
Integral of spectrum 12 is 100.0
Integral of spectrum 13 is 100.0
Integration range is [ 0.0, 20000.0 ]
Example - Total peak intensity:
from mantid.kernel import DeltaEModeType, UnitConversion
import numpy
ws = CreateSampleWorkspace(
    Function='Flat background',
    XMin=0,
    XMax=12000,
    BinWidth=20)
nHisto = ws.getNumberHistograms()

# Add elastic peaks to 'ws'. They will be at different TOFs
# since the detector banks will be 5 and 10 metres from the sample.

# First, a helper function for the peak shape
def peak(shift, xs):
    xs = (xs[:-1] + xs[1:]) / 2.0  # Convert to bin centres.
    return 50 * numpy.exp(-numpy.square(xs - shift) / 1200)

# Now, generate the elastic peaks.
Ei = 23.0  # Incident energy, meV
L1 = 10.0 # Source-sample distance, m
sample = ws.getInstrument().getSample()
for i in range(nHisto):
    detector = ws.getDetector(i)
    L2 = sample.getDistance(detector)
    tof = UnitConversion.run('Energy', 'TOF', Ei, L1, L2, 0.0, DeltaEModeType.Direct, Ei)
    ys = ws.dataY(i)
    ys += peak(tof, ws.readX(i))

# Fit Gaussians to the workspace.
# Fit results will be put into a table workspace 'epps'.
epps = FindEPP(ws)

# Integrate the peaks over +/- 3*sigma
lowerLimits = numpy.empty(nHisto)
upperLimits = numpy.empty(nHisto)
for i in range(nHisto):
    peakCentre = epps.cell('PeakCentre', i)
    sigma = epps.cell('Sigma', i)
    lowerLimits[i] = peakCentre - 3 * sigma
    upperLimits[i] = peakCentre + 3 * sigma

totalIntensity = Integration(ws,
    RangeLowerList=lowerLimits,
    RangeUpperList=upperLimits)

print('Intensity of the first peak: {:.5}'.format(totalIntensity.dataY(0)[0]))
print('Intensity of the last peak: {:.5}'.format(totalIntensity.dataY(nHisto-1)[0]))
Output:
Intensity of the first peak: 159.99
Intensity of the last peak: 164.5
Categories: AlgorithmIndex | Arithmetic | Transforms\Rebin