\(\renewcommand\AA{\unicode{x212B}}\)
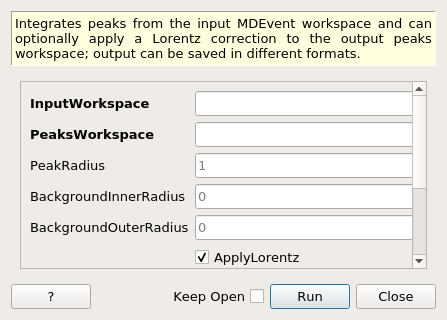
HB3AIntegratePeaks dialog.
Table of Contents
Integrates peaks from the input MDEvent workspace and can optionally apply a Lorentz correction to the output peaks workspace; output can be saved in different formats.
| Name | Direction | Type | Default | Description |
|---|---|---|---|---|
| InputWorkspace | Input | str list | Mandatory | Input MDEvent workspace to use for integration |
| PeaksWorkspace | Input | str list | Mandatory | Peaks workspace containing peaks to integrate |
| PeakRadius | Input | number | 1 | Fixed radius around each peak position in which to integrate (same units as input workspace) |
| BackgroundInnerRadius | Input | number | 0 | Inner radius used to evaluate the peak background |
| BackgroundOuterRadius | Input | number | 0 | Outer radius used to evaluate the peak background |
| ApplyLorentz | Input | boolean | True | Whether the Lorentz correction should be applied to the integrated peaks |
| RemoveZeroIntensity | Input | boolean | True | If to remove peaks with 0 or less intensity from the output |
| OutputFormat | Input | string | SHELX | Save direction cosines in HKL, or the fullprof format. Allowed values: [‘SHELX’, ‘Fullprof’] |
| OutputFile | Input | string | Filepath to save the integrated peaks workspace in HKL format | |
| OutputWorkspace | Output | Workspace | Mandatory | Output peaks workspace (copy of input with updated peak intensities) |
Uses a MDEventWorkspace and PeaksWorkspace to integrate the peaks provided in the peaks workspace. A LorentzCorrection can be optionally applied to the integrated peaks with the ApplyLorentz option.
The output peaks workspace can be written to OutputFile in either SHELX format with direction cosines using SaveHKL or in the Fullprof format using SaveReflections.
The input to this algorithm is intended as part of the DEMAND data reduction workflow, using HB3AAdjustSampleNorm and HB3AFindPeaks or HB3APredictPeaks which can be seen below in the example usage.
You can make use of ConvertQtoHKLMDHisto to view the data in HKL.
There are a few ways to go about processing DEMAND (HB3A) data. First you can simply load the data with HB3AAdjustSampleNorm, then predict the peaks positions with HB3APredictPeaks using the existing UB in the data workspace, then integrate peaks with HB3AIntegratePeaks.
If you don’t have the correct UB you can use HB3AFindPeaks to find peaks and the UB, then integrate the peaks found with HB3AIntegratePeaks. Alternatively, once you found the new UB you can use it to predict all expected peaks with HB3APredictPeaks.

Example - DEMAND Workflow predicting peaks
# Input detector scan data to use. Can be a list of files, or workspaces - see HB3AAdjustSampleNorm for details
data_files = "HB3A_exp0724_scan0182.nxs, HB3A_exp0724_scan0183.nxs"
# Converts to MDEventWorkspace
# If needed, the sample position can be adjusted by a height and distance - see the HB3AAdjustSampleNorm docs
data = HB3AAdjustSampleNorm(Filename=data_files)
# Finds peaks on the combined workspace, optimizing the UB matrix for the given cell type parameters
# lattice parameters can be optionally specified to calculate the UB matrix (see docs for HB3AFindPeaks)
peaks = HB3APredictPeaks(InputWorkspace=data,
ReflectionCondition='B-face centred')
# Integrate the predicted peaks from the workspace above
integrated_peaks = HB3AIntegratePeaks(InputWorkspace=data, PeaksWorkspace=peaks,
PeakRadius=0.25,
OutputFile="./integrated_peaks.hkl")
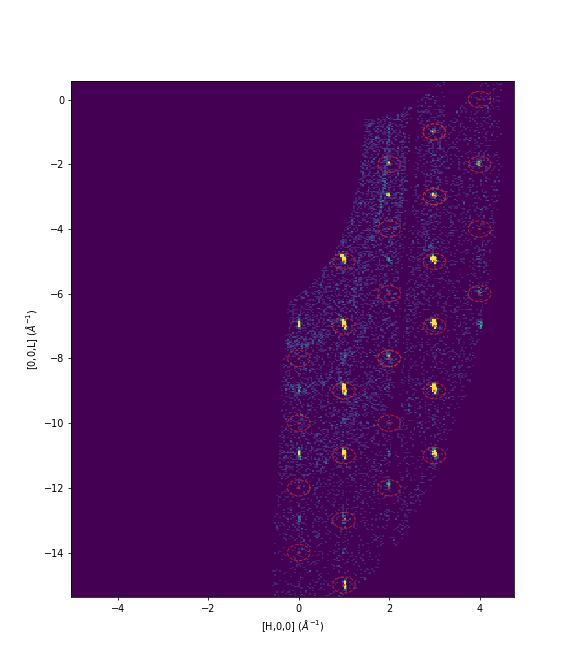
# To visualize the combined data sets you can merge them together and overlay the integrated peaks in sliceviewer
merged = MergeMD(data)
# You can also convert the merged data in HKL to visualize the HKL data and overlay the integrated peaks in sliceviewer, see figure below
HKL = ConvertQtoHKLMDHisto(merged,
Extents='-5.1,5.1,-2.1,2.1,-20.1,20.1',
Bins='251,101,1001')
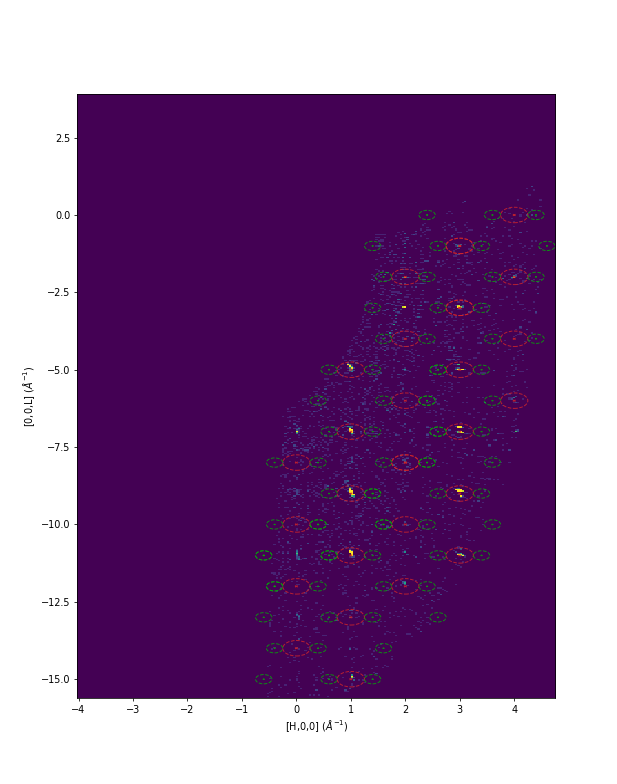
Example - DEMAND Workflow predicting satellite peaks
Following on from the previous example we will predict some (fictional) satellite peaks.
# Using a modulation vector of ±0.4H.
satellites_peaks = HB3APredictPeaks(InputWorkspace=data,
                                    ReflectionCondition='B-face centred',
                                    SatellitePeaks=True,
                                    ModVector1='0.4,0,0',
                                    MaxOrder=1,
                                    IncludeIntegerHKL=False)
integrated_satellites_peaks = HB3AIntegratePeaks(InputWorkspace=data, PeaksWorkspace=satellites_peaks,
                                                 PeakRadius=0.15,
                                                 OutputFormat="Fullprof",
                                                 OutputFile="./integrated_satellite_peaks.hkl")
You will see the modulation vectors in the output file
head -15 ./integrated_satellite_peaks.hkl
gives
integrated_satellites_peaks
(4i4,2f12.2,i5,4f10.4)
  1.00800 0 0
       2
    1     0.400000     0.000000     0.000000
    2    -0.400000    -0.000000    -0.000000
 #  h   k   l   m      Fsqr       s(Fsqr)   Cod   Lambda
   -1   1 -11   1        0.56        1.00    1    1.0080
    0   1 -12   2        3.60        2.45    1    1.0080
    0   1 -10   2       10.75        4.58    1    1.0080
    0   1  -8   2        2.94        2.65    1    1.0080
    0   0 -12   1       17.45        5.48    1    1.0080
    0   0 -10   1       28.58        7.62    1    1.0080
    0   0  -8   1       43.19       10.39    1    1.0080
    0   1 -10   1       17.98        5.83    1    1.0080
Red is the predicted nuclear peaks and green is the predicted satellite peaks
Example - DEMAND Workflow finding peaks and determining the UB
# Input detector scan data to use. Can be a list of files, or workspaces - see HB3AAdjustSampleNorm for details
data_files = "HB3A_exp0724_scan0182.nxs, HB3A_exp0724_scan0183.nxs"

# Converts to MDEventWorkspace
#  If needed, the sample position can be adjusted by a height and distance - see the HB3AAdjustSampleNorm docs
data = HB3AAdjustSampleNorm(Filename=data_files)

# Finds peaks on the combined workspace, optimizing the UB matrix for the given cell type parameters
#  lattice parameters can be optionally specified to calculate the UB matrix (see docs for HB3AFindPeaks)
peaks = HB3AFindPeaks(InputWorkspace=data,
                      CellType="Orthorhombic",
                      Centering="F")

# Integrate the peaks from the optimized peaks workspace above
integrated_peaks = HB3AIntegratePeaks(InputWorkspace=data,
                                      PeaksWorkspace=peaks,
                                      PeakRadius=0.25,
                                      OutputFile="./integrated_peaks.hkl")

# Alternatively, predict the peaks using the newly found UB, then integrate
predicted_peaks = HB3APredictPeaks(InputWorkspace=data,
                                   UBWorkspace=peaks,
                                   ReflectionCondition='B-face centred')
integrated_predicted_peaks = HB3AIntegratePeaks(InputWorkspace=data,
                                                PeaksWorkspace=predicted_peaks,
                                                PeakRadius=0.25,
                                                OutputFile="./integrated_peaks.hkl")
Categories: AlgorithmIndex | Crystal\Integration
Python: HB3AIntegratePeaks.py