\(\renewcommand\AA{\unicode{x212B}}\)
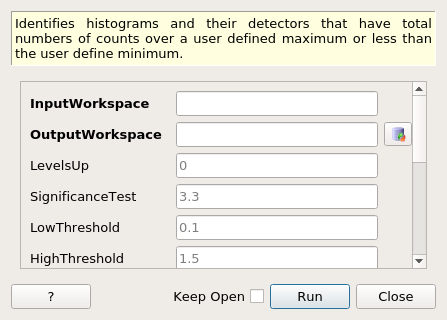
MedianDetectorTest dialog.
Table of Contents
Identifies histograms and their detectors that have total numbers of counts over a user defined maximum or less than the user define minimum.
| Name | Direction | Type | Default | Description |
|---|---|---|---|---|
| InputWorkspace | Input | MatrixWorkspace | Mandatory | Name of the input workspace |
| OutputWorkspace | Output | MatrixWorkspace | Mandatory | A MaskWorkspace where 0 denotes a masked spectra. Any spectra containinga zero is also masked on the output |
| LevelsUp | Input | number | 0 | Levels above pixel that will be used to compute the median. If no level is specified, or 0, the median is over the whole instrument. |
| SignificanceTest | Input | number | 3.3 | Error criterion as a multiple of error bar i.e. to fail the test, the magnitude of the difference with respect to the median value must also exceed this number of error bars |
| LowThreshold | Input | number | 0.1 | Lower acceptable bound as fraction of median value |
| HighThreshold | Input | number | 1.5 | Upper acceptable bound as fraction of median value |
| LowOutlier | Input | number | 0.01 | Lower bound defining outliers as fraction of median value |
| HighOutlier | Input | number | 100 | Upper bound defining outliers as fraction of median value |
| ExcludeZeroesFromMedian | Input | boolean | False | If false (default) zeroes will be included in the median calculation, otherwise they will not be included but they will be left unmasked |
| StartWorkspaceIndex | Input | number | 0 | The index number of the first spectrum to include in the calculation (default 0) |
| EndWorkspaceIndex | Input | number | Optional | The index number of the last spectrum to include in the calculation (default the last histogram) |
| RangeLower | Input | number | Optional | No bin with a boundary at an x value less than this will be included in the summation used to decide if a detector is ‘bad’ (default: the start of each histogram) |
| RangeUpper | Input | number | Optional | No bin with a boundary at an x value higher than this value will be included in the summation used to decide if a detector is ‘bad’ (default: the end of each histogram) |
| CorrectForSolidAngle | Input | boolean | False | Flag to correct for solid angle efficiency. False by default. |
| NumberOfFailures | Output | number |
If instrument geometry information is available the SolidAngle v1 algorithm is used to calculate the number of counts per unit solid angle, otherwise numbers of counts are used without correction. First the median number of counts in all the bins is calculated. Then the ratio of the total number of counts and the median number is calculated for each histogram. This ratio is compared against the user defined upper and lower thresholds and if the ratio is outside the limits the statistical significance test is done.
In the statistical significance test the difference between the number of counts in each spectrum and the median number is compared to the spectrum’s error value. Any spectra where the ratio of the its deviation from the mean and the its error is less than the value of the property SignificanceTest will not be labelled bad. This test is particularly important when the number of counts is low, for example when examining the low count “background” parts of spectra.
Optionally, some might want to do median on a tube, or a bank. For that, use the LevelsUp input. For example, in the CNCS instrument, the detector is called a pixel. The parent of a pixel is a tube, while an eightpack contains 8 tubes. To calculate the median of a tube, use LevelsUp=1, for an eightpack use LevelsUp=2. LevelsUp=0 will calculate the median over the whole instrument.
The output workspace contains a MaskWorkspace where those spectra that fail the tests are masked and those that pass them are assigned a single positive value.
Uses the SolidAngle v1, Integration v1 and ConvertToDistribution v1 algorithms.
Categories: AlgorithmIndex | Diagnostics