\(\renewcommand\AA{\unicode{x212B}}\)
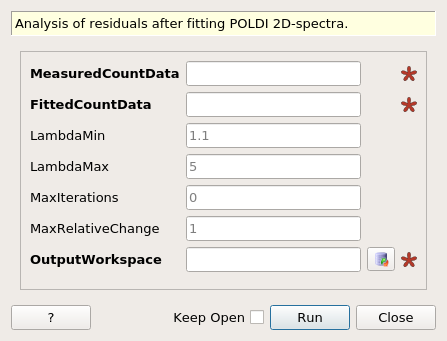
PoldiAnalyseResiduals dialog.
Table of Contents
| Name | Direction | Type | Default | Description |
|---|---|---|---|---|
| MeasuredCountData | Input | Workspace2D | Mandatory | Input workspace containing the measured data. |
| FittedCountData | Input | Workspace2D | Mandatory | Input workspace containing the fitted data. |
| LambdaMin | Input | number | 1.1 | Minimum wavelength to be considered. |
| LambdaMax | Input | number | 5 | Maximum wavelength to be considered. |
| MaxIterations | Input | number | 0 | Maximum number of iterations. Default 0 does not limit number of iterations. |
| MaxRelativeChange | Input | number | 1 | Relative change in counts (in percent) that should be reached. |
| OutputWorkspace | Output | Workspace2D | Workspace containing the residual correlation spectrum. |
After fitting a model to POLDI 2D-data the residuals have to be analysed in order to determine whether the data are described by the model. Since this is very hard to see in the two dimensional residual data, the analysis involves a procedure that is very similar to the correlation method implemented in PoldiAutoCorrelation v5. The method is slightly different because the residual at a given point may be either positive or negative.
The algorithm iteratively calculates the correlation spectrum of the residual data, distributes the correlation counts over the 2D residual data and normalizes the residuals so that their sum is equal to zero. The correlation spectra of all steps are accumulated and returned as output. In the spectrum it’s for example possible to spot additional peaks, which may have been hidden in by larger peaks in a first data analysis.
Note
To run these usage examples please first download the usage data, and add these to your path. In Mantid this is done using Manage User Directories.
The following example shows how to calculate the residuals following a fit performed with PoldiFitPeaks2D v1 on Silicon data that had been collected for a calibration measurement.
# Load data from file, load instrument and truncate data to correct size
data_Si_raw = Load("Poldi2013Silicon.nxs")
LoadInstrument(data_Si_raw, InstrumentName="POLDI", RewriteSpectraMap=True)
data_Si = PoldiTruncateData(data_Si_raw)

# Perform correlation method, find and refine peaks in correlation spectrum
correlation_Si = PoldiAutoCorrelation(data_Si)
peaks_Si_raw = PoldiPeakSearch(correlation_Si)

# Only use the 11 strongest peaks
DeleteTableRows(TableWorkspace=peaks_Si_raw, Rows="11-20")

peaks_Si_1D = PoldiFitPeaks1D(correlation_Si, FwhmMultiples=4, PoldiPeakTable="peaks_Si_raw",

                                FitPlotsWorkspace = "fit_plots_Si",
                                Version=1)

# Fit peaks to original 2D data
fit_result_Si_2D = PoldiFitPeaks2D(data_Si,
                                PoldiPeakWorkspace="peaks_Si_1D", MaximumIterations=100,
                                RefinedPoldiPeakWorkspace="peaks_Si_2D",
                                Calculated1DSpectrum="fit_result_Si_1D")

# Calculate residuals
residuals_Si = PoldiAnalyseResiduals(MeasuredCountData=data_Si, FittedCountData="fit_result_Si_2D", MaxIterations=5)

residual_data = residuals_Si.readY(0)

print("Residuals are in the range: [ {:.2f} ,  {:.2f} ]".format(round(min(residual_data), 2), round(max(residual_data), 2)))
The output contains the range in which residuals are found:
Residuals are in the range: [ -2361.45 , 2651.65 ]
Categories: AlgorithmIndex | SINQ\Poldi