\(\renewcommand\AA{\unicode{x212B}}\)
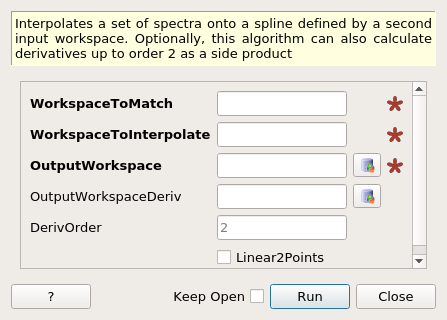
SplineInterpolation dialog.
Table of Contents
Interpolates a set of spectra onto a spline defined by a second input workspace. Optionally, this algorithm can also calculate derivatives up to order 2 as a side product
| Name | Direction | Type | Default | Description |
|---|---|---|---|---|
| WorkspaceToMatch | Input | MatrixWorkspace | Mandatory | The workspace which defines the points of the spline. |
| WorkspaceToInterpolate | Input | MatrixWorkspace | Mandatory | The workspace on which to perform the interpolation algorithm. |
| OutputWorkspace | Output | MatrixWorkspace | Mandatory | The workspace containing the calculated points and derivatives |
| OutputWorkspaceDeriv | Output | WorkspaceGroup | The workspace containing the calculated derivatives | |
| DerivOrder | Input | number | 2 | Order to derivatives to calculate. |
| Linear2Points | Input | boolean | False | Set to true to perform linear interpolation if only 2 points are present. |
The algorithm performs interpolation of points onto a cubic spline. The algorithm takes two input workspaces: one that is used to define the spline and one that contains a number of spectra to be interpolated onto the spline.
If multiple spectra are defined in the WorkspaceToInterpolate workspace, they will all be interpolated against the first spectra in WorkspaceToMatch.
Optionally, this algorithm can also calculate the first and second derivatives of each of the interpolated points as a side product. Setting the DerivOrder property to zero will force the algorithm to calculate no derivatives.
For the points outside the x-axis range covered by the WorkspaceToInterpolate, flat extrapolation will be performed.
The algorithm can also perform linear interpolation by enabling Linear2Points if the WorkspaceToInterpolate has only 2 bins. Only 1st order derivative can be computed in this case. X-axis of the workspace to match must be sorted in ascending order.
If the input workspace contains histograms, rather than data points, then SplineInterpolation will automatically convert the input to point data for interpolation. The original inputs however will not be modified. The output returned will be in the same format as the input.
Histogram workspaces being interpolated will show a warning when the range of the data is equal to the size of the workspace to match, but has finer bin boundaries. This is because histogram data is converted to point data using the average of the bin boundaries. This will cause some values to fall outside of the range of the spline when fine bin boundaries are used.
Example - interpolate between points in one workspace to match a reference workspace:
import numpy as np

#create a smooth function for interpolation
dataX1 = np.arange(1, 100) * 0.07
dataY1 = np.sin(dataX1)
spline_ws = CreateWorkspace(dataX1, dataY1)

#create some random points to interpolate between
dataX2 = np.arange(1,110,10) * 0.07
dataY2 = np.random.random_sample(dataX2.size)
ws = CreateWorkspace(dataX2, dataY2)

#interpolate using the reference workspace
interpolated_ws = SplineInterpolation(WorkspaceToMatch=spline_ws, WorkspaceToInterpolate=ws, DerivOrder=0)
Example - output the derivatives of the interpolated workspace:
import numpy as np

#create a smooth function for interpolation
dataX1 = np.arange(1, 100) * 0.07
dataY1 = np.sin(dataX1)
spline_ws = CreateWorkspace(dataX1, dataY1)

#create some random points to interpolate between
dataX2 = np.arange(1,110,10) * 0.07
dataY2 = np.random.random_sample(dataX2.size)
ws = CreateWorkspace(dataX2, dataY2)

#interpolate using the reference workspace and output a group workspace of derivatives for each spectrum
interpolated_ws = SplineInterpolation(WorkspaceToMatch=spline_ws, WorkspaceToInterpolate=ws, DerivOrder=2, OutputWorkspaceDeriv='derivs')
Example - linear interpolation:
iws = CreateSampleWorkspace(NumBanks = 1, XMin = 7, XMax = 29, BinWidth = 11)
mws = CreateSampleWorkspace(NumBanks = 1, XMin = 6, XMax = 30, BinWidth = 3)
ows = SplineInterpolation(WorkspaceToMatch = mws, WorkspaceToInterpolate = iws, Linear2Points = True, DerivOrder = 0)

import numpy

for y in numpy.nditer(ows.readY(0)):
    print("%0.2f"% y)
10.30
10.30
9.39
6.66
3.94
1.21
0.30
0.30
Categories: AlgorithmIndex | Optimization | CorrectionFunctions\BackgroundCorrections