\(\renewcommand\AA{\unicode{x212B}}\)
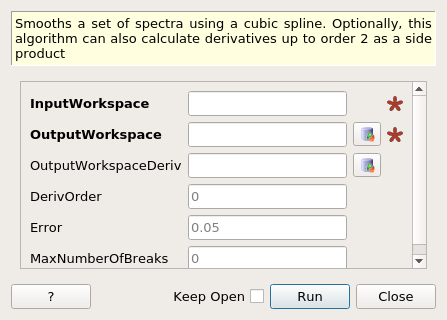
SplineSmoothing dialog.
Table of Contents
Smooths a set of spectra using a cubic spline. Optionally, this algorithm can also calculate derivatives up to order 2 as a side product
| Name | Direction | Type | Default | Description |
|---|---|---|---|---|
| InputWorkspace | Input | MatrixWorkspace | Mandatory | The workspace on which to perform the smoothing algorithm. |
| OutputWorkspace | Output | MatrixWorkspace | Mandatory | The workspace containing the calculated points |
| OutputWorkspaceDeriv | Output | WorkspaceGroup | The workspace containing the calculated derivatives | |
| DerivOrder | Input | number | 0 | Order to derivatives to calculate. |
| Error | Input | number | 0.05 | The amount of error we wish to tolerate in smoothing |
| MaxNumberOfBreaks | Input | number | 0 | To set the positions of the break-points, default 0 equally spaced real values in interval 0.0 - 1.0 |
The algorithm performs a smoothing of the input data using a cubic spline. The algorithm takes a 2D workspace and generates a spline for each of the spectra to approximate a fit of the data.
Optionally, this algorithm can also calculate the first and second derivatives of each of the interpolated points as a side product. Setting the DerivOrder property to zero will force the algorithm to calculate no derivatives.
The algorithm provides user with an option of including number of breaking points which will enable the algorithm to execute functions with large number of spikes or noise. With the control of number of breaking points, user will be able to execute SplineSmoothing algorithm in small period of time. The lower breaking points number is set the faster algorithm will execute the function but it will not produce high quality smoothing function. By inserting high number of breaking points, a detailed smoothing function can also be produced. By not providing MaxNumberOfBreaks, the algorithm will assume that user would like to execute the maximum number of breaks possible. This comes with a risk of algorithm falling in to a very long loop.
By providing MaxNumberOfBreaks as a parameter, the users are also will be able to successfully and efficiently apply the algorithm to a workspace with multiple spectrums, which would generate an output of workspace with multiple spectrums of SplineSmoothing algorithm applied to it. BSpline can be used to help you understand break-points in further detail.
If the input workspace contains histograms, rather than data points, then SplineInterpolation will automatically convert the input to point data. The output returned with be in the same format as the input.
Example - Smoothing noisy data:
ws = CreateSampleWorkspace("Histogram","Multiple Peaks",
    BankPixelWidth=1, NumBanks=10, Random=True,
    XMax=30, BinWidth=0.3)
wsOut = SplineSmoothing(ws,Error=1)

print("This has created a spline for each spectra in the %s workspace" % wsOut)

try:
    plotSpectrum([ws,wsOut],0)
except NameError:
    # plotSpectrum was not available
    pass
Output:
This has created a spline for each spectra in the wsOut workspace
Categories: AlgorithmIndex | Optimization | CorrectionFunctions\BackgroundCorrections