\(\renewcommand\AA{\unicode{x212B}}\)
Other Plot Types
General Plot Help
Basic 1D and Tiled Plots - Table of contents
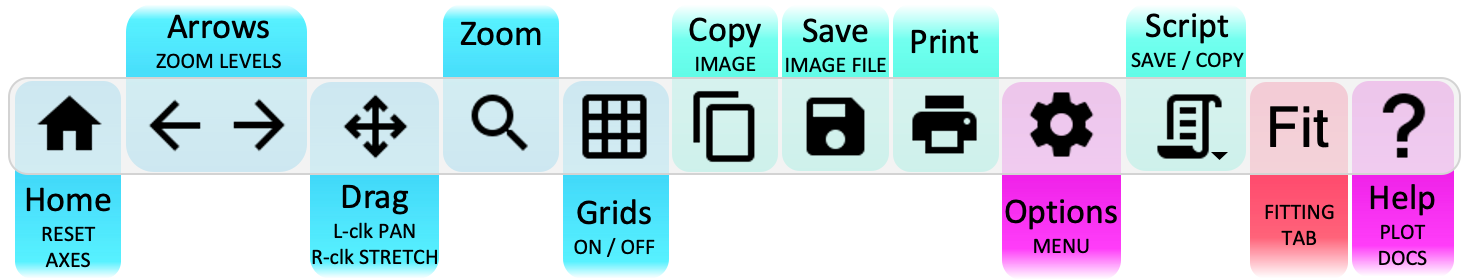
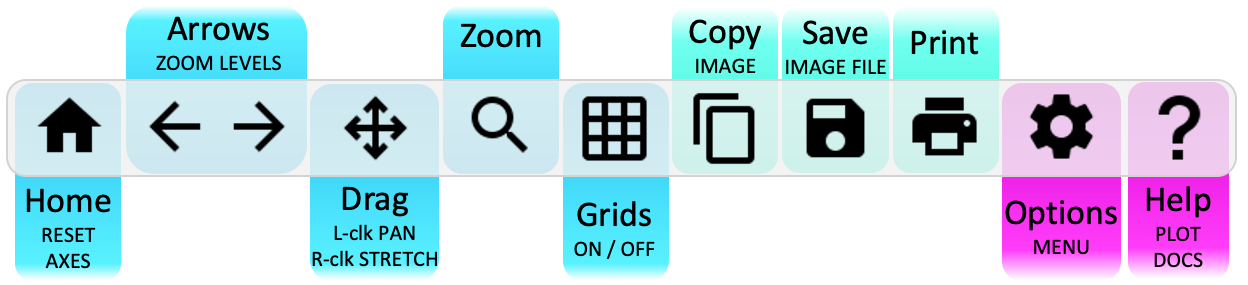
 ptions Menu
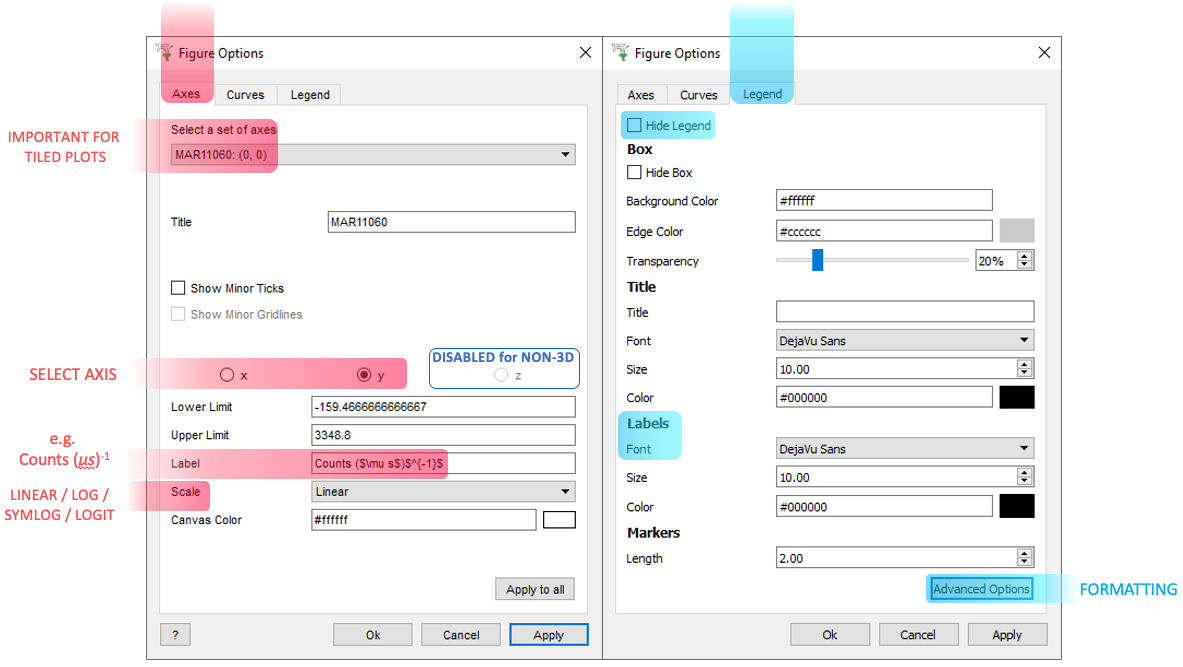
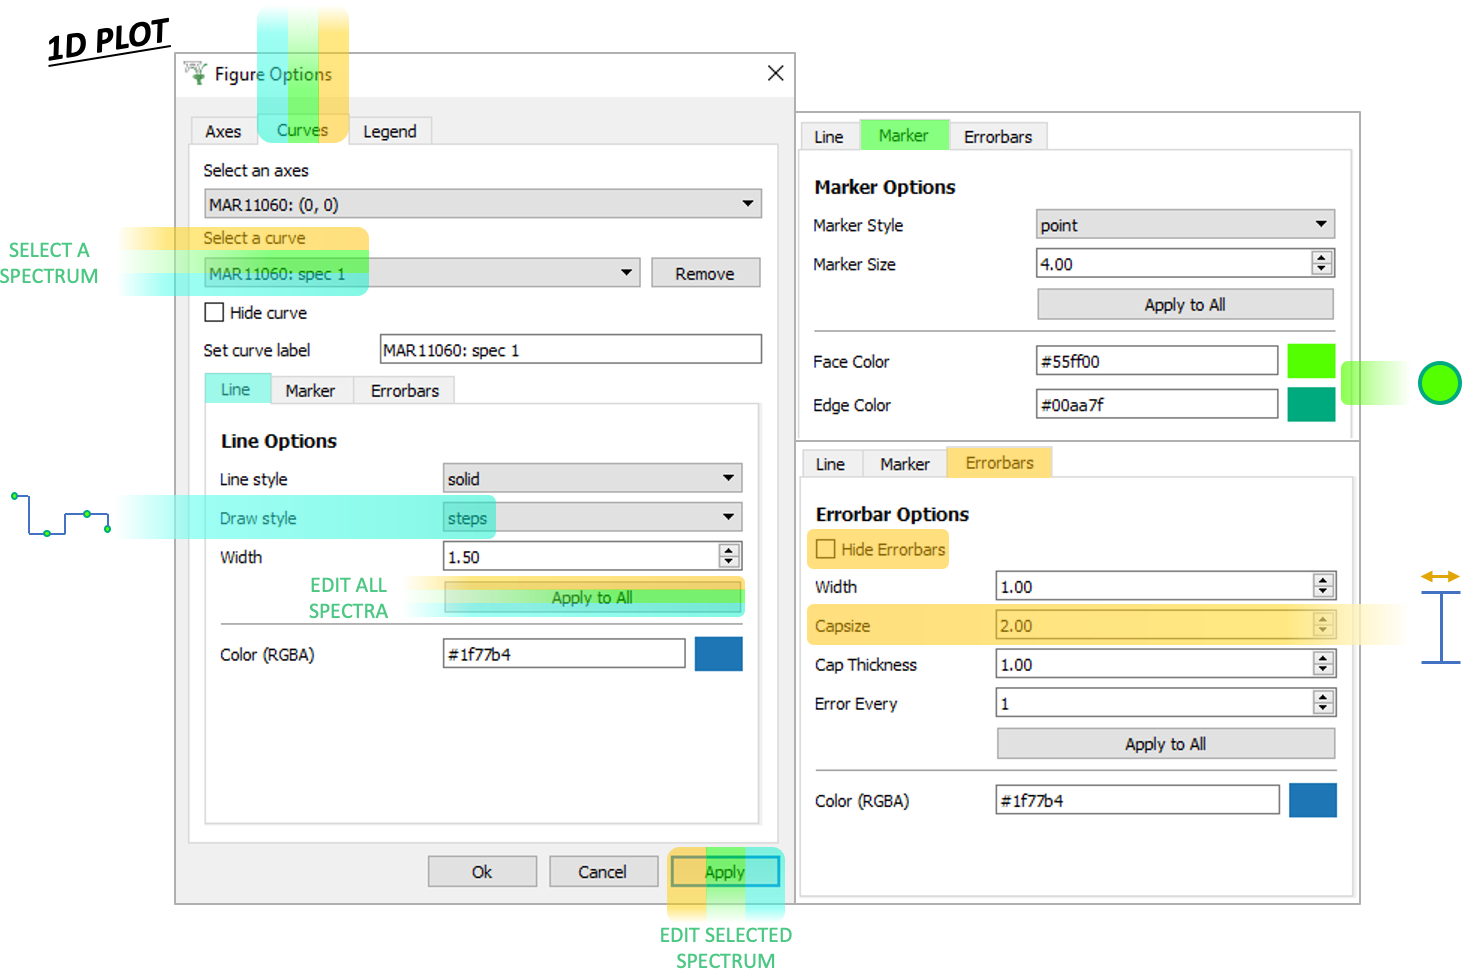
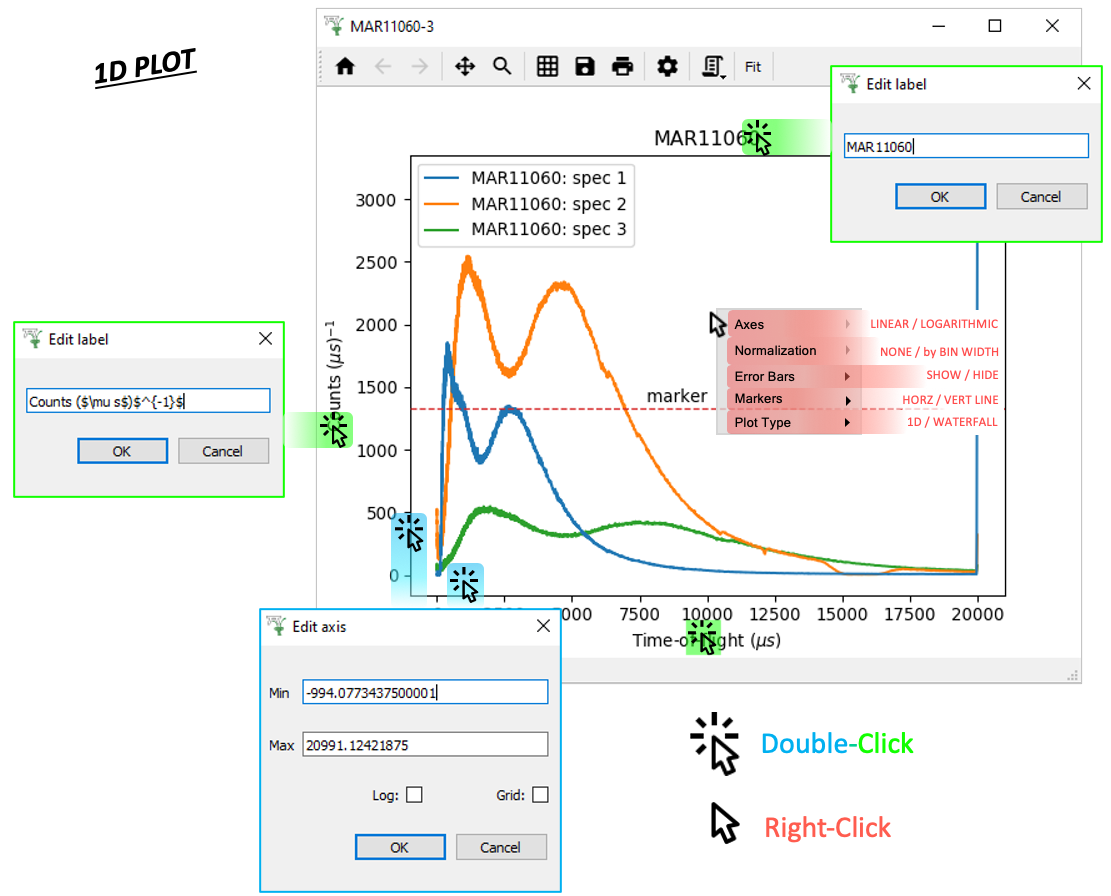
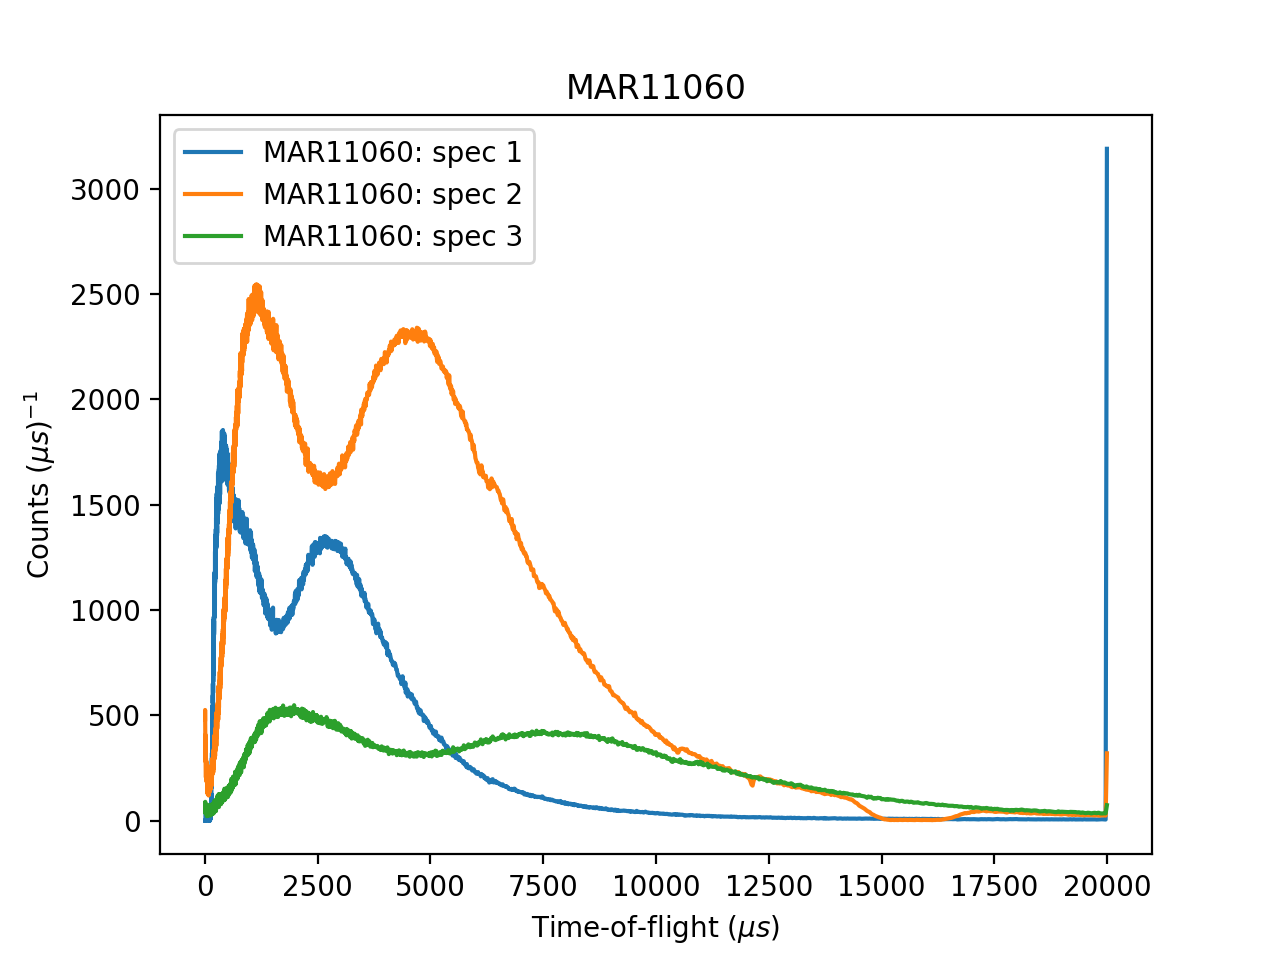
Click the generate a script button  on a 1D Plot:
# import mantid algorithms, numpy and matplotlib
from mantid.simpleapi import *
import matplotlib.pyplot as plt
import numpy as np
from mantid.api import AnalysisDataService as ADS
MAR11060 = ADS.retrieve('MAR11060') #May replace with Load('MAR11060')
fig, axes = plt.subplots(edgecolor='#ffffff', num='MAR11060-1', subplot_kw={'projection': 'mantid'})
axes.plot(MAR11060, color='#1f77b4', label='MAR11060: spec 1', specNum=1)
axes.plot(MAR11060, color='#ff7f0e', label='MAR11060: spec 2', specNum=2)
axes.plot(MAR11060, color='#2ca02c', label='MAR11060: spec 3', specNum=3)
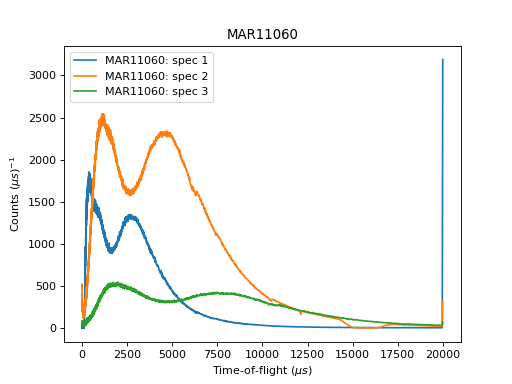
axes.set_title('MAR11060')
axes.set_xlabel('Time-of-flight ($\mu s$)')
axes.set_ylabel('Counts ($\mu s$)$^{-1}$')
axes.legend().draggable()
plt.show()
(Source code, png, hires.png, pdf)

For more advice: Formatting Plots with a script
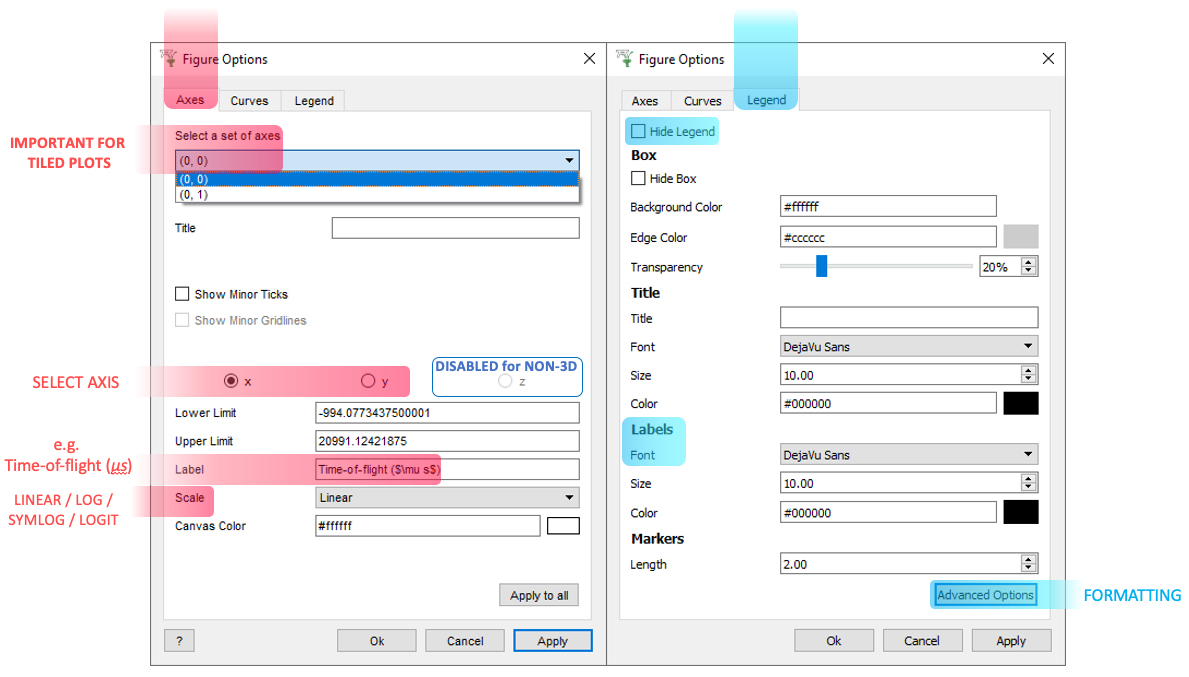
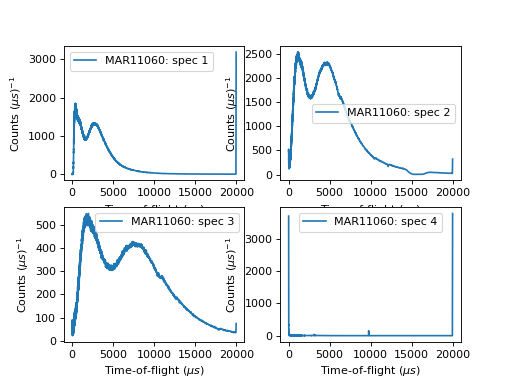
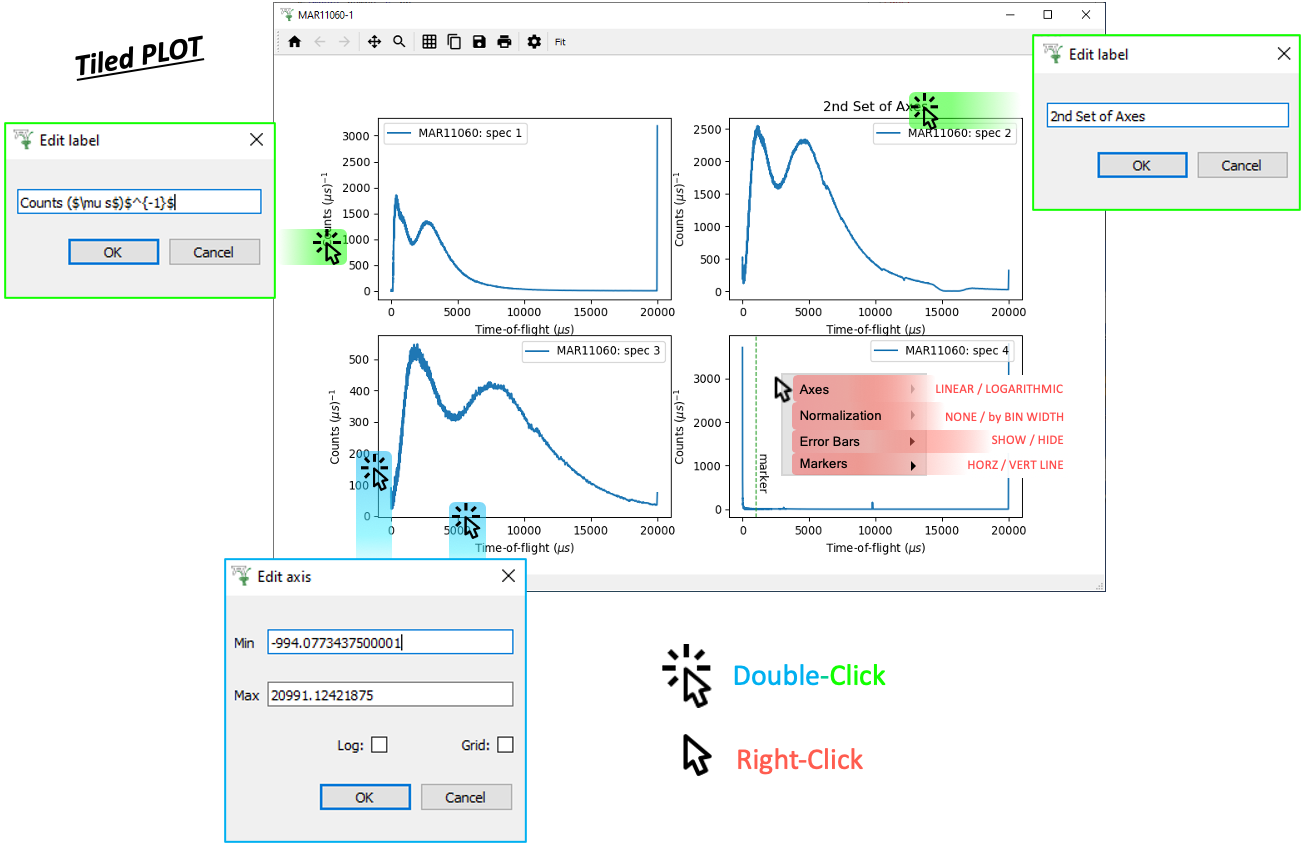
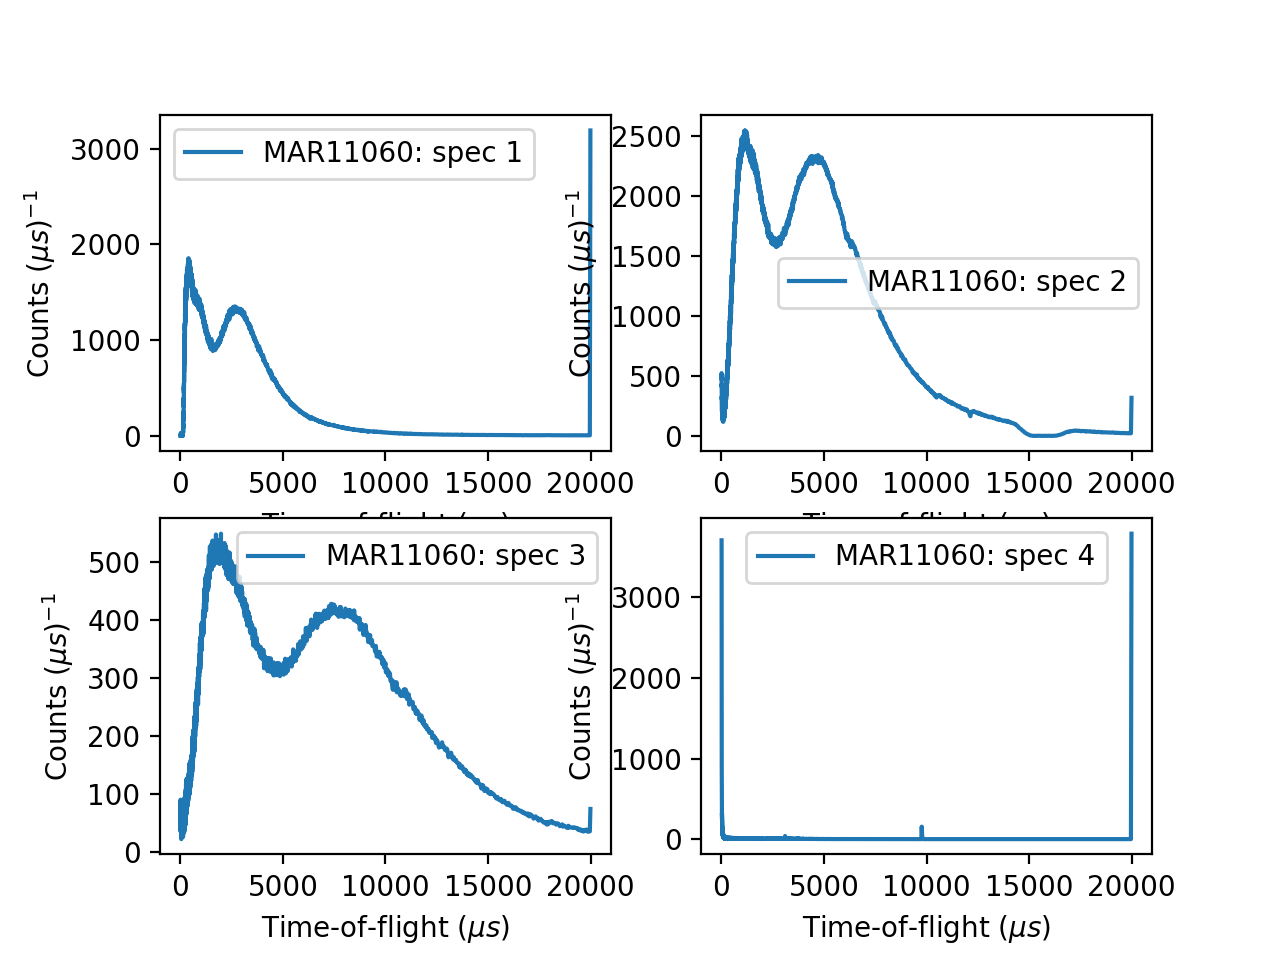
ptions Menu¶Tiled plots are essentially an array of axes (1D plots) on the same figure. As such, when editing them in the Options Menu, you should take care to select the correct set of axes:
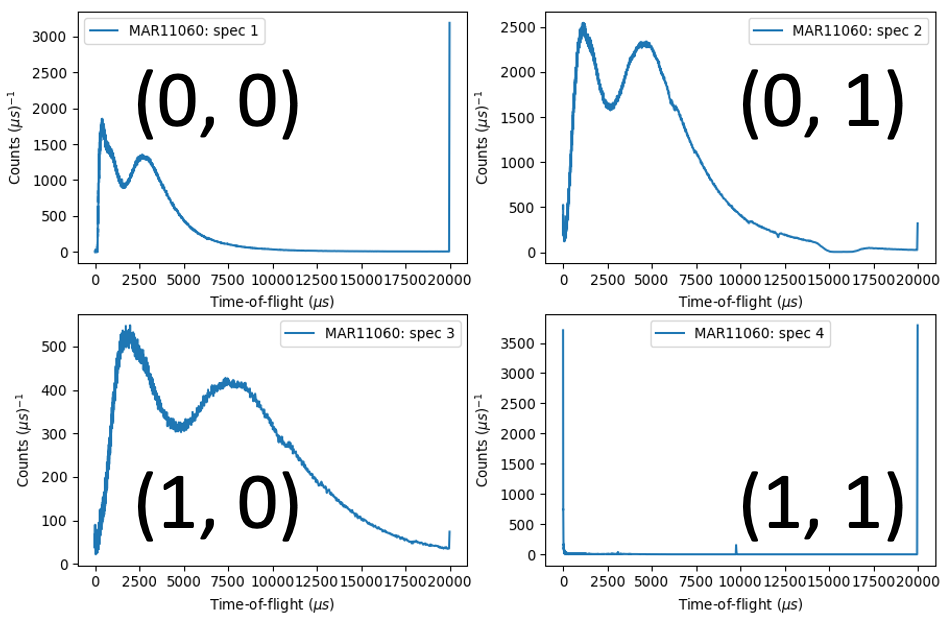
An example script for a Tiled Plot:
# import mantid algorithms, numpy and matplotlib
from mantid.simpleapi import *
import matplotlib.pyplot as plt
import numpy as np

from mantid.api import AnalysisDataService as ADS

MAR11060 = ADS.retrieve('MAR11060') #May replace with Load('MAR11060')

fig, axes = plt.subplots(edgecolor='#ffffff', ncols=2, nrows=2, num='MAR11060-1', subplot_kw={'projection': 'mantid'})
axes[0][0].plot(MAR11060, color='#1f77b4', label='MAR11060: spec 1', specNum=1)
axes[0][0].set_xlabel('Time-of-flight ($\mu s$)')
axes[0][0].set_ylabel('Counts ($\mu s$)$^{-1}$')
axes[0][0].legend().draggable()

axes[0][1].plot(MAR11060, color='#1f77b4', label='MAR11060: spec 2', specNum=2)
axes[0][1].set_xlabel('Time-of-flight ($\mu s$)')
axes[0][1].set_ylabel('Counts ($\mu s$)$^{-1}$')
axes[0][1].legend().draggable()

axes[1][0].plot(MAR11060, color='#1f77b4', label='MAR11060: spec 3', specNum=3)
axes[1][0].set_xlabel('Time-of-flight ($\mu s$)')
axes[1][0].set_ylabel('Counts ($\mu s$)$^{-1}$')
axes[1][0].legend().draggable()

axes[1][1].plot(MAR11060, color='#1f77b4', label='MAR11060: spec 4', specNum=4)
axes[1][1].set_xlabel('Time-of-flight ($\mu s$)')
axes[1][1].set_ylabel('Counts ($\mu s$)$^{-1}$')
axes[1][1].legend().draggable()

plt.show()
(Source code, png, hires.png, pdf)
For more advice: Formatting Plots with a script