\(\renewcommand\AA{\unicode{x212B}}\)
Basic 1D, 2D and 3D Plots
plotSpectrum and plotBin
Right-clicking a workspace from the Workspaces Toolbox and selecting Show Data creates a Data Matrix, which displays the underlying data in a worksheet.
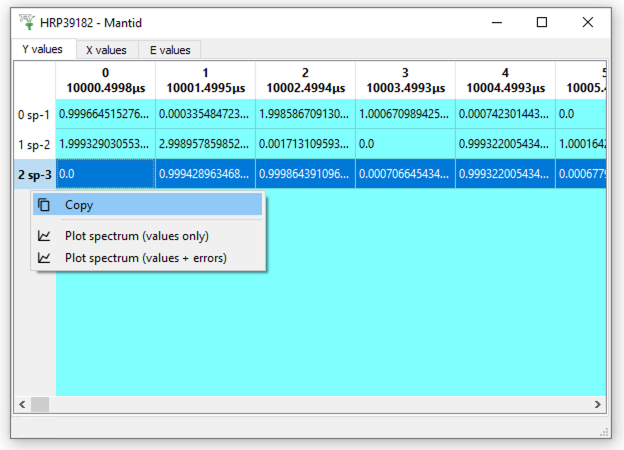
Right clicking on a row or a column allows a plot of that spectrum or time bin, which can also be achieved in Python using the plotSpectrum() or plotBin() functions, e.g.
RawData = Load("MAR11015")

graph_spec = plotSpectrum(RawData, 0)
graph_time = plotBin(RawData, 0)
To include error bars on a plot, there is an extra argument that can be set to ‘True’ to enable them, e.g.
graph_spec = plotSpectrum(RawData, 0, error_bars=True)
graph_time = plotBin(RawData, 0, error_bars=True)
For setting scales, axis titles, plot titles etc. you can use:
RawData = Load("MAR11015")
plotSpectrum(RawData,1, error_bars=True)

# Get current axes of the graph
fig, axes = plt.gcf(), plt.gca()

plt.yscale('log')

# Rescale the axis limits
axes.set_xlim(0,5000)

#C hange the y-axis label
axes.set_ylabel('Counts ($\mu s$)$^{-1}$')

# Add legend entries
axes.legend(['Good Line'])

# Give the graph a modest title
plt.title("My Wonderful Plot", fontsize=20)
Multiple workspaces/spectra can be plotted by providing lists within the plotSpectrum() or plotBin() functions, e.g.
# Plot multiple spectra from a single workspace
plotSpectrum(RawData, [0,1,3])

# Here you need to load files into RawData1 and RawData2 before the next two commands

# Plot a spectrum from different workspaces
plotSpectrum([RawData1,RawData2], 0)

# Plot multiple spectra across multiple workspaces
plotSpectrum([RawData1,RawData2], [0,1,3])
To overplot on the same window:
RawData = Load("MAR11015")

# Assign original plot to a window called graph_spce
graph_spec = plotSpectrum(RawData, 0)

# Overplot on that window, without clearing it
plotSpectrum(RawData, 1, window=graph_spec, clearWindow=False)
2D Colourfill and Contour Plots
2D plots can be produced as an image or a pseudocolormesh (for a non-regular grid):

Enable :plots: using DOCS_PLOTDIRECTIVE in CMake
Enable :plots: using DOCS_PLOTDIRECTIVE in CMake
Contour lines can be overlayed on a 2D colorfill:
Enable :plots: using DOCS_PLOTDIRECTIVE in CMake
3D Surface and Wireframe Plots
3D plots Surface and Wireframe plots can also be created:
Enable :plots: using DOCS_PLOTDIRECTIVE in CMake
Enable :plots: using DOCS_PLOTDIRECTIVE in CMake
See here for custom color cycles and colormaps