\(\renewcommand\AA{\unicode{x212B}}\)
Plotting with Python
Contents
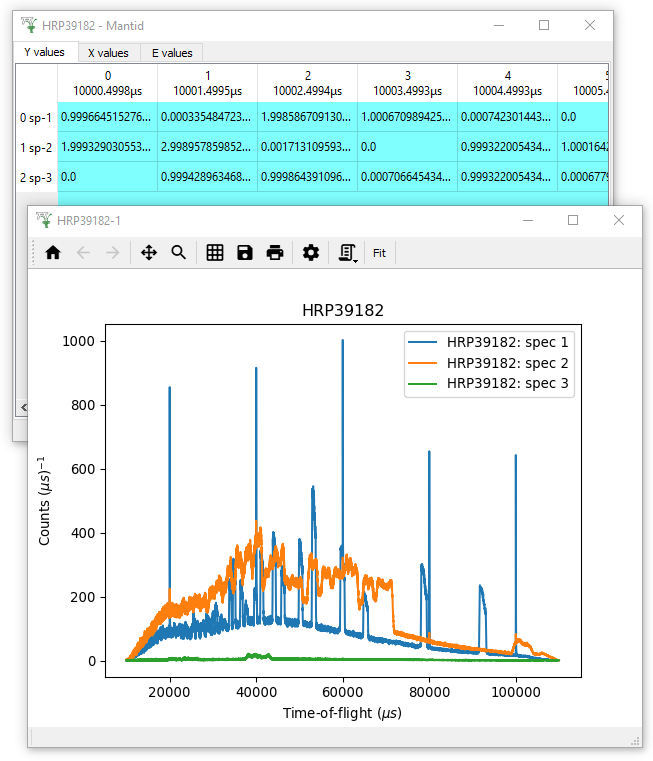
To display results within Workbench, a user can view workspaces as a data matrix and also plot graphs from the results.
This section explains how to plot with Mantid and Matplotlib, in particular how to script plots to your preference.