IntegratePeaksSkew v1#
Summary#
Integrates single-crystal peaks in a MatrixWorkspace by identifying the peak pixels in a window on the detector by minimising the skew of the points in the background. The TOF extent of the peak is determined by maximising I/\(\sigma\) for the peak pixels identified using the skew method.
See Also#
Properties#
Name |
Direction |
Type |
Default |
Description |
|---|---|---|---|---|
InputWorkspace |
Input |
Mandatory |
A MatrixWorkspace to integrate (x-axis must be TOF or d-Spacing). |
|
PeaksWorkspace |
Input |
IPeaksWorkspace |
Mandatory |
A PeaksWorkspace containing the peaks to integrate. |
NRows |
Input |
number |
17 |
Number of row components in the window around a peak on the detector. For WISH row components correspond to pixels along a single tube. |
NCols |
Input |
number |
17 |
Number of column components in the window around a peak on the detector. For WISH column components correspond to tubes. |
BackscatteringTOFResolution |
Input |
number |
0.04 |
dTOF/TOF of window for peaks at back-scattering (resolution dominated by moderator contribution, dT0/T0, and uncertainty in path length dL/L which is assumed constant for all pixels). |
ThetaWidth |
Input |
number |
0.1 |
dTheta resolution in degrees (estimated from width at forward scattering minus contribution from moderator, dT0/T0, and path length dL/L). To use a constant fractional TOF width for all peaks set ThetaWidth = 0. |
ScaleThetaWidthByWavelength |
Input |
boolean |
False |
If true the ThetaWidth will be multiplied by the wavelength of a peak. If the ThetaWidth is dominated by the beam divergence, which is proportional to wavelength, set this to true. |
GetTOFWindowFromBackToBackParams |
Input |
boolean |
False |
If true the TOF window will be taken to be NFWHM x FWHM of the BackToBackExponential peak at that position (evaluated using coefficients defined in the instrument Parameters.xml file. |
NFWHM |
Input |
number |
4 |
Initial TOF window is NFWHM x FWHM of the BackToBackExponential peak at that position |
OptimiseXWindowSize |
Input |
boolean |
True |
If True the size of the xWindow will be optimised to maximise I/Sigma. If False the xwindow will be translated to maximise I/sigma in region +/- 2(initial_xwindow) |
ThresholdIoverSigma |
Input |
number |
0 |
Threshold I/sigma before optimising x window size. |
OptimiseMask |
Input |
boolean |
False |
Redo peak mask using optimal TOF window discovered (the original mask is found from the integrated intensity over a TOF window determined from the resolution parameters). A new optimal TOF window is then found using the new peak mask.Note this can be helpful if resolution parameters or peak centres are not very accurate. |
IntegrateIfOnEdge |
Input |
boolean |
False |
Integrate peaks that contain pixels on edge of the detector. |
NRowsEdge |
Input |
number |
1 |
Masks including pixels on rows NRowsEdge from the detector edge are defined as on the edge. |
NColsEdge |
Input |
number |
1 |
Masks including pixels on cols NColsEdge from the detector edge are defined as on the edge. |
NPixMin |
Input |
number |
3 |
Minimum number of pixels contributing to a peak |
DensityPixMin |
Input |
number |
0.35 |
Minimum density of peak pixels in bounding box |
NRowMax |
Input |
number |
15 |
Maximum number of rows in peak mask (note on WISH rows are equivalent to pixels). |
NColMax |
Input |
number |
15 |
Maximum number of columns in peak mask (note on WISH cols are equivalent to tubes). |
NVacanciesMax |
Input |
number |
0 |
Maximum number of vacancies (contiguous regions of non-peak pixels entirely contained within the peak mask) for a valid peak. |
NPixPerVacancyMin |
Input |
number |
1 |
Minimum number of pixels in a vacancy |
NTOFBinsMin |
Input |
number |
4 |
Minimum number of TOF bins in a peak |
UseNearestPeak |
Input |
boolean |
False |
Find nearest peak pixel if peak position is in a background pixel. |
UpdatePeakPosition |
Input |
boolean |
False |
If True then the peak position will be updated to be the detid with the largest integrated counts over the optimised TOF window, and the peak TOF will be taken as the maximum of the focused data in the TOF window. |
OutputFile |
Input |
string |
Optional file path in which to write diagnostic plots (note this will slow the execution of algorithm). Allowed extensions: [‘.pdf’] |
|
LorentzCorrection |
Input |
boolean |
True |
Correct the integrated intensity by multiplying by the Lorentz factor sin(theta)^2 / lambda^4 - do not do this if the data have already been corrected. |
OutputWorkspace |
Output |
IPeaksWorkspace |
Mandatory |
The output PeaksWorkspace will be a copy of the input PeaksWorkspace with the integrated intensities. |
Description#
IntegratePeaksSkew is an algorithm that integrates single-crystal Bragg peaks in a MatrixWorkspace
by identifying the detectors and bins that contribute to a peak by minimising the skew (third moment) of the points in
the background.
The algorithm is inspired by seed-skew integration methods for peaks on image plates used in monochromatic x-ray instruments [1]. The seed-skew method [1] has previously been directly applied to 3D Bragg peaks from TOF neutron Laue data [2], however it has been noted that skew methods typically underestimate the intensity of weak reflections (due to premature termination of the seed growth) - a systematic effect that is expected to be worse for 3D Bragg peaks.
In order to improve the performance and more accurately integrate weak reflections a different approach is used here: data are integrated over an initial TOF (or d-spacing) window in order to maximise the signal-to-noise and then a 2D peak mask is determined to find the detectors contributing to the peak; data in these detectors are then focused (and a background subtracted) before applying the same method to identify the bins that contribute to the peak in the focused spectrum. The full TOF (or d-spacing) extent of the peak is determined by maximising \(I/\sigma\) (similar to integration methods for step-scans with monochromatic x-rays [3]) starting from a seed of bins identified using the skew method. The user can then optionally use the optimal TOF (or d-spacing) extent to repeat the procedure to find the detectors contributing to the peak.
Technically this algorithm does not use the seed-skew algorithm to grow an initial seed, rather non-background points are found by minimising the skew of the background, subsequently nearest-neighbour connected regions are found in the non-background points and a single region is assigned to the peak (by proximity to the expected peak position).
Note this algorithm can apply the Lorentz correction to the integrated intensity if LorentzCorrection=True.
For each peak the algorithm proceeds as follows:
Calculates an initial TOF (or d-spacing) window evaluating a resolution function for the fractional width (which is the same for TOF and d-spacing) of the form
\[\frac{dTOF}{TOF} = \sqrt{(\cot(\theta)d\theta)^2 + \left(\frac{dt_0}{t_0}\right)^2 + \left(\frac{dL}{L}\right)^2}\]where \(dTOF\) refers to the integration window size rather than the FWHM of a peak, the parameter
BackscatteringTOFResolutionis the fractional window size (\(dTOF/TOF\)) of a peak at backscattering (equivalent to \(\sqrt{(\frac{dt_0}{t_0})^2 + (\frac{dL}{L})^2}\)) andThetaWidth\(= d\theta\) (which is adjusted to reproduce the window size required for peaks at larger scattering angles). Note that for that for instances when the angular resolution is dominated by the beam divergence, it is possible to scale \(= d\theta\) by the wavelength by settingScaleThetaWidthByWavelength = True(to account for the wavelength dependence of the divergence). After execution the algorithm will print to the log estimates for these parameters given the scattering angle dependence of the final TOF window found for the peaks successfully integrated.Integrate the data over the range \(TOF_{peak} \pm 0.5*dTOF\)
Find the detectors contributing to the background by minimising the skew of the integrated intensity of detectors in a rectangular window of dimensions
NRow x NCol.Take the peak mask (detectors which contribute to the peak) to be the contiguous region of nearest-neighbour connected detectors not contributing to the background that contains the peak detector ID (or if
UseNearest=Truethen it will be the nearest region).Focuses the data (in TOF) for detectors assigned to the peak subtracting the spectra from a shell of adjacent background pixels. This has the added benefit of roughly subtracting powder lines (if the detectors are close enough for powder lines to roughly line up in TOF when averaged over the mask/shell).
Find the bins in the focused spectrum contributing to the peak by minimising the skew in the TOF window.
Increase the TOF window until the ratio of \(I/\sigma\) reaches a maximum.
If
OptimiseMask=Truethen steps 3-7 will be repeated using the optimal TOF window to find the detectors contributing to the peak.The bins contributing to the peak in the focused spectrum are summed (with the errors added in quadrature).
Assumptions about the instrument#
This algorithm supports instruments with detector banks of two types: RectangularDetector
(e.g. SXD, TOPAZ) and a more generic type CompAssembly (e.g WISH) - for which the behaviour of the algorithm is
slightly different.
For RectangularDetector the window around the peak on the detector is truncated at the
window edge - it is assumed that banks are not adjacent and that a peak can only reside in a single bank.
For CompAssembly banks, if the window on the detector exceed the boundaries of a bank, the algorithm will look for
pixels in nearby banks for which the column components are adjacent. For example on WISH the column components are tubes,
if a tube on one bank is adjacent to a tube from another bank the detector window will include pixels from both banks
(it will not be truncated). The algorithm does not look for pixels in tubes above/below the top/bottom of a tube.
In addition the instrument definition for CompAssembly banks must obey the following rules (which hold for the
WISH instrument):
Row and column components must have names that end with an integer index (e.g.
pixel066andtube152).The index must start from 1 (i.e. the first tube in a bank would be
tube001nottube000)Any n-1 detector-spectrum mapping groups only row components (i.e. pixels in the same tube) - in this case
NRowwill correspond to the number of spectra along a tube.
Peak mask validation#
The algorithm includes several parameters that allow the peak mask (detectors contributing to the peak) to be validated before advancing to step 5.
Integration of peaks on the edge of a detector#
To integrate peaks for which the peak mask includes pixels on the edge of the detector bank set IntegrateIfOnEdge=True.
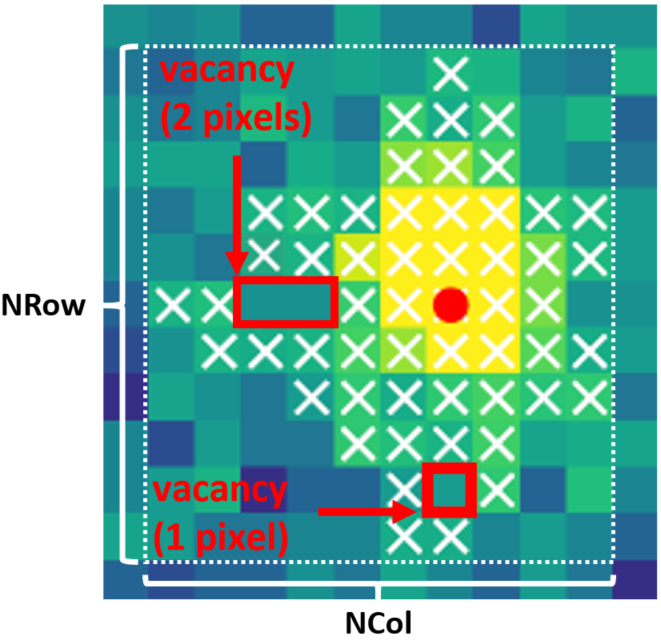
Vacancies#
Defined as regions of background pixels entirely enclosed within the peak mask - examples of vacancies are shown below.
If more than NVacanciesMax vacancies are found with a number of pixels greater than or equal to
NPixPerVacancyMin then the peak is not integrated.
Peak size and shape#
The minimum number of pixels allowed for a peak is set using the parameter NPixMin.
Limits on the peak size can be set with parameters NColMax and NRowMax which are upper limits on NCol and
NRow, the number of columns and rows in the bounding box of the peak mask (as labelled in the image above).
There can also be a limit on the minimum density, DensityPixMin, of the peak mask (the total number of detectors in
the mask divided by the area of the bounding box.
Finding nearby peaks#
If the parameter UseNearest=True then the peak will be integrated using a mask that contains the nearest
contiguous region of nearest-neighbour connected detectors not contributing to the background), even if the detector ID
of the peak corresponds to a background detector (as identified in step 3).
If UpdatePeakPosition=True then the peak detector ID will be replaced with the detector ID corresponding to the
maxiumum integrated intensity over the TOF window which maximises \(I/\sigma\). The peak TOF will be replaced
with the TOF of the maximum in the focused spectrum.
Plotting#
Optionally the user can ask for a pdf to be saved to OutputFile. For each peak the file contains a 2D colorfill plot
showing the peak mask and the data integrated over the TOF window that maximises \(I/\sigma\), and the
focused, background subtracted spectra with vertical lines to mark the initial and optimal TOF window and the peak
centre.
In addition a graph of the found \(dTOF/TOF\) vs \(\theta\) will be saved as shown below.

Useage#
Example:
from mantid.simpleapi import *

Load(Filename='SXD23767.raw', OutputWorkspace='SXD23767')
CreatePeaksWorkspace(InstrumentWorkspace='SXD23767', NumberOfPeaks=0, OutputWorkspace='SingleCrystalPeakTable')
AddPeak(PeaksWorkspace='SingleCrystalPeakTable', RunWorkspace='SXD23767', TOF=3271, DetectorID=32615)
AddPeak(PeaksWorkspace='SingleCrystalPeakTable', RunWorkspace='SXD23767', TOF=3806, DetectorID=30017)
AddPeak(PeaksWorkspace='SingleCrystalPeakTable', RunWorkspace='SXD23767', TOF=5009, DetectorID=42513)
AddPeak(PeaksWorkspace='SingleCrystalPeakTable', RunWorkspace='SXD23767', TOF=2486, DetectorID=39170)
AddPeak(PeaksWorkspace='SingleCrystalPeakTable', RunWorkspace='SXD23767', TOF=2613, DetectorID=40740)
AddPeak(PeaksWorkspace='SingleCrystalPeakTable', RunWorkspace='SXD23767', TOF=2328, DetectorID=40905)
AddPeak(PeaksWorkspace='SingleCrystalPeakTable', RunWorkspace='SXD23767', TOF=1703, DetectorID=28764)
AddPeak(PeaksWorkspace='SingleCrystalPeakTable', RunWorkspace='SXD23767', TOF=2449, DetectorID=41068)
AddPeak(PeaksWorkspace='SingleCrystalPeakTable', RunWorkspace='SXD23767', TOF=2303, DetectorID=40121)
AddPeak(PeaksWorkspace='SingleCrystalPeakTable', RunWorkspace='SXD23767', TOF=2038, DetectorID=36910)
AddPeak(PeaksWorkspace='SingleCrystalPeakTable', RunWorkspace='SXD23767', TOF=3787, DetectorID=42749)
AddPeak(PeaksWorkspace='SingleCrystalPeakTable', RunWorkspace='SXD23767', TOF=886, DetectorID=14284)
AddPeak(PeaksWorkspace='SingleCrystalPeakTable', RunWorkspace='SXD23767', TOF=1817, DetectorID=36104)

IntegratePeaksSkew(InputWorkspace='SXD23767', PeaksWorkspace='SingleCrystalPeakTable',
    OutputWorkspace='out', OutputFile="out.pdf",
    UseNearestPeak=True, IntegrateIfOnEdge=True, NVacanciesMax=0, NPixPerVacancyMin=2,
    BackScatteringTOFResolution=0.04, ThetaWidth=1, UpdatePeakPosition=True)
References#
Categories: AlgorithmIndex | Diffraction\Reduction
Source#
Python: IntegratePeaksSkew.py