ISIS Reflectometry Interface#
Purpose#
This user interface allows for batch processing of data reduction for reflectometry data. The actual data reduction is performed with ReflectometryReductionOneAuto. Wherever possible, this interface attempts to use reasonable defaults, either loaded from the instruments’ parameter files, or calculated from the provided data, to minimise the amount of user input required. This interface also strives to be transparent, making it clear how your data is being processed, and easy to adjust any of the options used.
Integration with data archives is also provided, allowing for data to be located and prepared for reduction automatically.
Information on how to resolve common problems can be found in the Troubleshooting section of this document.
Example Workflow#
Sample Data#
To follow this example you will need the ISIS reflectometry example materials:
INTER00013460.nxsINTER00013462.nxsINTER00013463.nxsINTER00013464.nxs
These can be downloaded as part of the ISIS example data.
Once they are downloaded, place the nxs files in one of Mantid’s user directories. To see a list of directories, click on File -> Manage User Directories.
Processing Runs#
Open MantidWorkbench and open the ISIS
Reflectometry interface from the menu: Interfaces -> Reflectometry -> ISIS
Reflectometry
First, we want to enter the runs that we will process into the table. Enter the values as shown in the figure below. Just the run number and the angle is the minimum requirement.
Tip
You can use the Toolbar or Keyboard Shortcuts to edit the table,
e.g. Tab between cells, Enter to add a new row, Ctrl-I to insert
a child row.
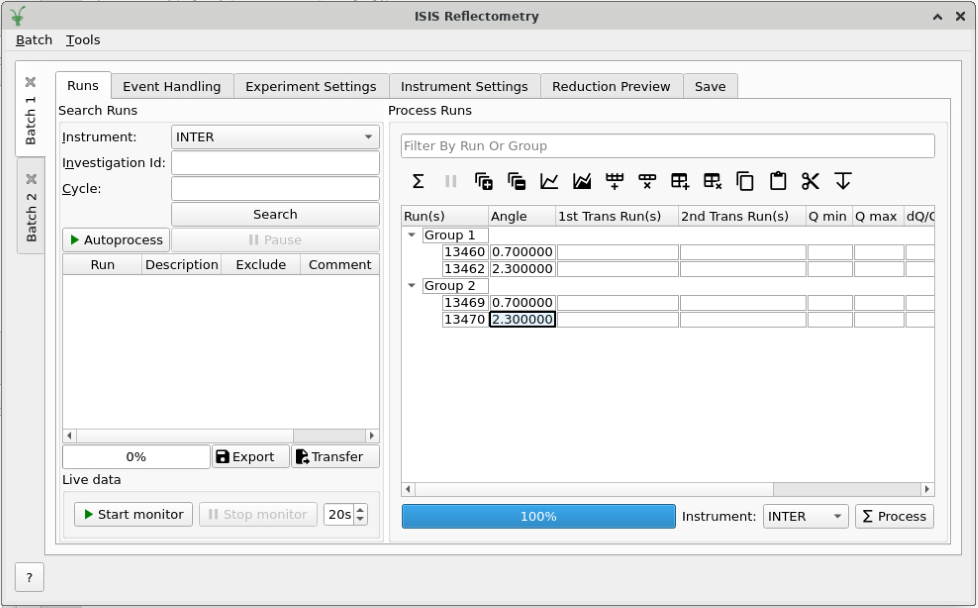
Run numbers and angles entered into the runs table#
Let’s process the first group, which consists of the first two rows of the
table (13460 and 13462). Select the group we want to process, and then click on
 Process.
The runs table after the first group has been processed with default settings#
The rows within the group should turn yellow (probably very briefly) to
indicate that they are processing, and then green when they have
completed. Once both rows have been processed, the group will be post-processed
and it will also turn green. The Q min, Q max and dQ/Q cells will
also be updated with the values that were calculated in the reduction.
Tip
If a row or group turns blue, it has an error. Hover over the row to see the error message and consult the Troubleshooting section of this document for guidance on fixing it.
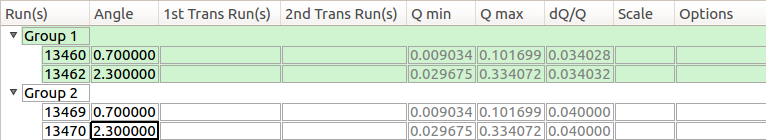
Editing Settings#
The above is a minimal reduction. We also want to use some transmission runs to
correct this data. We could enter these into the runs table but instead we will
use the Experiment Settings tab to set them as defaults for all runs. We
will also set the limits and resolution for the final rebinning in Q, and
output the debug workspaces.
Enter the following information on the table on the Experiment Settings
tab, and tick the Debug option. Then re-process the group.
Editing experiment settings#
Viewing Results#
You should now have several workspaces in the ADS. Amongst them should be:
Workspace |
Description |
|---|---|
TOF_13460 |
This is the data before processing. The X axis is time of flight in \(\mu s\). |
IvsQ_13460 |
This is the output workspace of ReflectometryReductionOneAuto. The X axis is momentum transfer in Å-1. |
IvsQ_13460_13462 |
This workspace is the result of stitching |
IvsLam_13460 |
This is the wavelength output workspace of
ReflectometryReductionOneAuto.
The X axis is wavelength in Å. It is only output if the |
TRANS_13463_13464 |
This is a transmission run, created by running
CreateTransmissionWorkspace
on |
For convenience, the interface provides tools to easily plot the main
outputs. The plot-rows  button plots the reduced runs
(i.e.
button plots the reduced runs
(i.e. IvsQ_binned_13460 and IvsQ_binned_13462) for the selected row(s),
and/or all rows in the selected group(s). The plot-groups  button
plots the stitched output for the selected group(s)
(i.e.
button
plots the stitched output for the selected group(s)
(i.e. IvsQ_13460_13462).
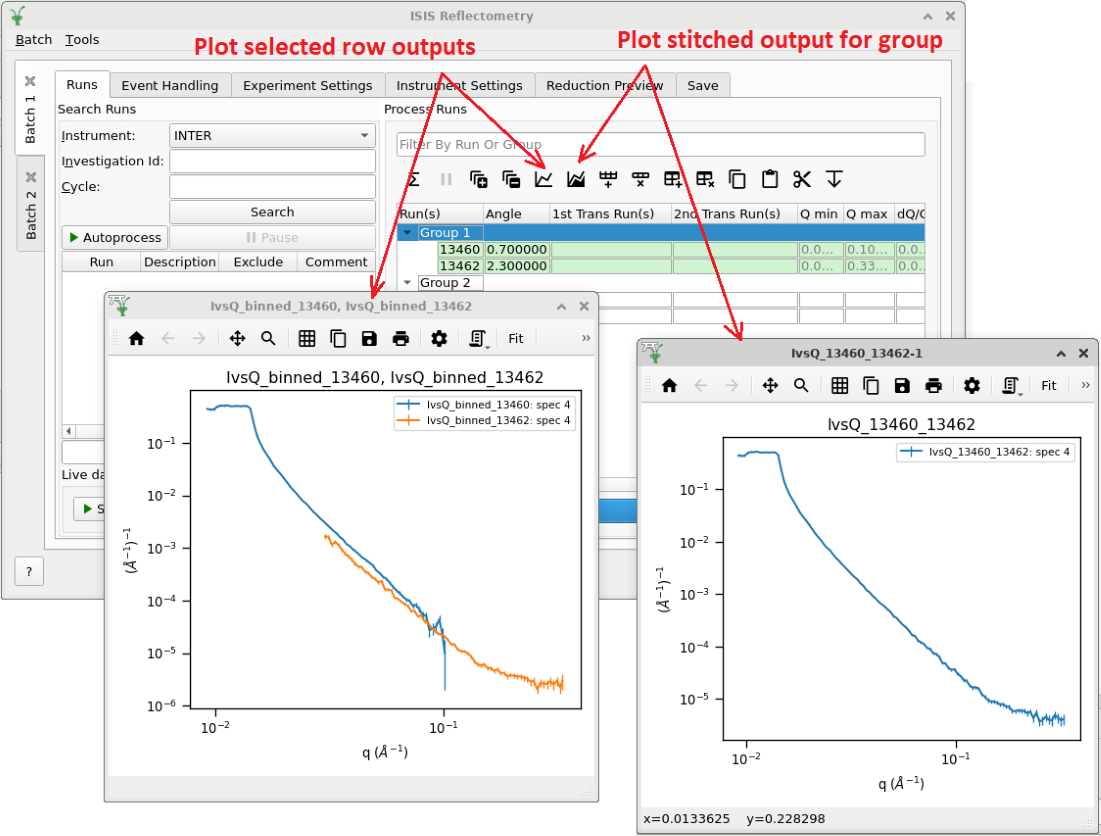
Plotting the results of the reduction#
Layout#
Batches#
The main window contains one or more “Batches”, which are shown as vertical tabs on the left. Each Batch contains a group of settings tabs (Runs, Event Handling, Experiment, Instrument and Save). Together, these provide all of the settings for a particular reduction.
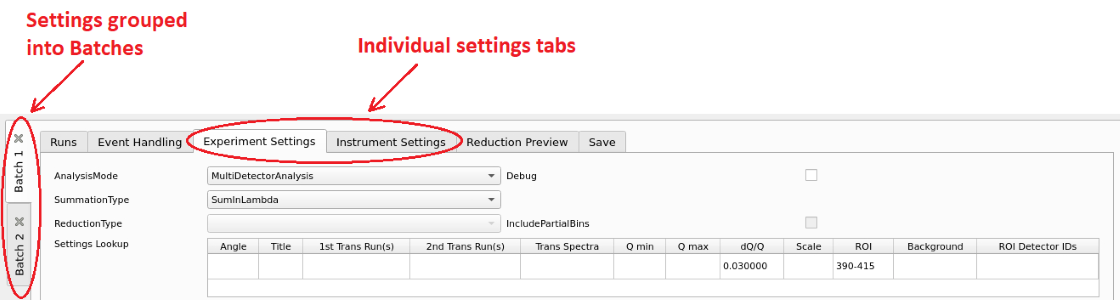
Batch tabs on the left contain all of the reduction settings for a particular batch of runs#
Using multiple batches is useful when users need to apply different options to
runs measured during the same experiment. For instance, if some runs need to be
analyzed with a wavelength range of LambdaMin=1, LambdaMax=17 but others
need a wavelength range of LambdaMin=1.5, LambdaMax=15, users may want to
enter the first set of runs in the processing table in one batch and the
second set in the processing table in another batch, and update the settings in
each batch accordingly. The interface will use the settings from the relevant
batch to reduce runs in that batch’s processing table.
Runs Tab#
This section describes the different elements in the Runs tab.
The runs tab#
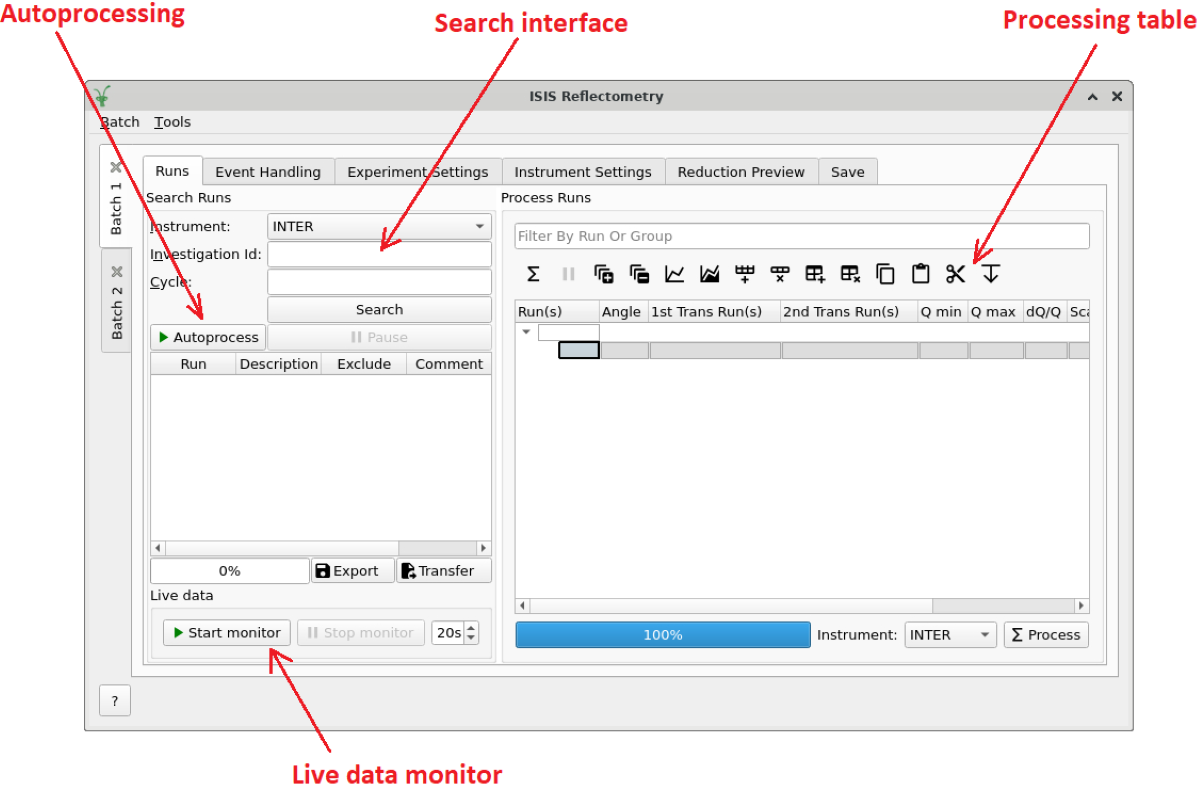
Processing Table#
The processing table is where the bulk of the work takes place. It is used to specify which runs to process, the properties that should be used to process them, and how the different runs should be joined together.
Each row represents a single reduction (i.e. execution of ReflectometryReductionOneAuto), and belongs to a group. Rows that are grouped together will have their output stitched together using Stitch1DMany.
Above the processing table is a Toolbar containing various actions for manipulating the processing table, and a filter bar to allow filtering of the table by group or run name. Various Keyboard Shortcuts are available to help with quickly editing the table.
To process, simply select the rows or groups you want to process and click
Process . Alternatively, if nothing is selected, the entire table
will be processed.
Below the table is a progress bar, which shows the current progress of any processing that is in progress. When processing the entire table, this will show the percentage of the entire table that is complete. When processing a selection it will show the percentage of that selection that is complete.
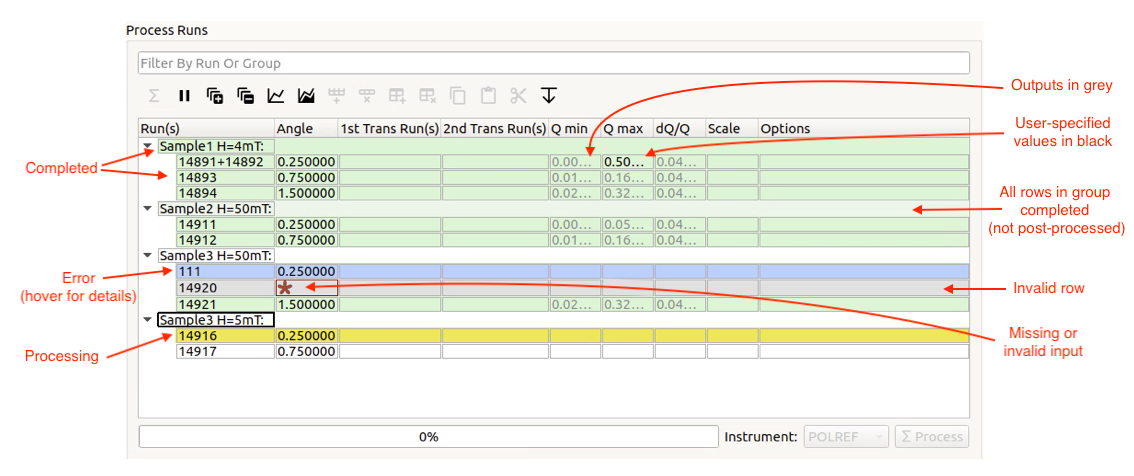
The processing table#
Rows or groups that are currently processing will be highlighted in yellow, and those that are successfully complete will be highlighted in green. Groups where all of the rows within it are complete, but post-processing has not yet completed, will be highlighted in a paler green. Groups with a single row do not need to be stitched, so will not be post-processed. If processing fails for any reason, the row/group will be highlighted in blue and you can hover over it to see a tooltip displaying the error message.
Editing any settings that may change the outputs will reset the state for all rows and groups. If any rows are added to or removed from a group, the group’s state will be reset. Deleting any of the mandatory output workspaces will also reset the relevant row or group states. Note however that if you rename a workspace, the interface will track it, so it will remain associated with its original row or group.
If reduction stops and is then resumed, the interface will re-process any rows
and groups within the current selection that have not been processed, or whose
state has been reset. If you manually select rows/groups that have an error
then they too will be reprocessed. However if you process the entire table
(i.e. click Process when nothing is selected), rows/groups that
have errors will not be reprocessed - you can manually select all rows in
the table if you want to reprocess them.
Note: The interface cannot be closed while runs are being processed. To
close the interface, you must first stop the reduction by clicking on the
Pause  button.
Columns#
The processing table contains the following columns:
Column Title |
Required? |
Description |
|---|---|---|
Run(s) |
Yes |
Contains the sample runs to be processed.
Runs may be given as run numbers or workspace
names. Multiple runs may be added together by
separating them with a Example: Note that if a workspace name contains |
Angle |
Yes |
Contains the angle used during the run, in degrees. If left blank, ReflectometryReductionOneAuto will calculate theta using SpecularReflectionCalculateTheta. Example: |
1st Trans Run(s) 2nd Trans Run(s) |
No |
Contains the transmission run(s) used to
normalise the sample runs. To specify two
transmission runs, enter them in each input box.
Note that as per the Run(s) column, you can sum multiple
runs for each input by entering multiple values separated by Example: |
Q min |
No |
Contains the minimum value of Q to be used in Å−1. Data with a value of Q lower than this will be discarded. If left blank, this is set to the lowest Q value found. This is useful for discarding noisy data. Example: |
Q max |
No |
Contains the maximum value of Q to be used in Å−1. Data with a value of Q higher than this will be discarded. If left blank, this is set to the highest Q value found. This is useful for discarding noisy data. Example: |
dQ/Q |
No |
Contains the resolution used when rebinning output workspaces. If left blank, this is calculated for you using the NRCalculateSlitResolution algorithm. This value is negated so that Logarithmic binning can be applied for the IvsQ workspace. If you desire linear binning then you may negate the value in the processing table and a linear binning will be applied. Example: |
Scale |
No |
Contains the factor used to scale output
IvsQ workspaces. The IvsQ workspaces are
scaled by Example: |
Options |
No |
Contains options that allow you to override
ReflectometryReductionOne’s properties.
To override a property, just use the property’s
name as a key, and the desired value as the
value.
Options are specified in Example: |
Toolbar#
This table details the behaviour of the actions in the tool bar, from left to right.

The runs table toolbar#
Action |
Effect |
|---|---|
|
Processes the selected runs, or, if no runs are selected, all of the runs in the table. When a group is selected, runs belonging to the same group are stitched together. |
|
Pauses processing any selected runs. Processing may be resumed by clicking on the ‘Process’ button. If the selection has changed, the new selection will be processed. |
|
Expand all groups so that you can see all child rows. |
|
Collapse all groups to hide all child rows. |
|
Creates a plot of the IvsQ workspaces generated by any of the selected rows (or all child rows of the selected groups). |
|
Creates a plot of the stitched IvsQ workspaces generated by any of the selected groups. |
|
Inserts a new child row into the selected group |
|
Deletes any selected rows. If no rows are selected, nothing happens. |
|
Adds a new group after the first selected group, or at the end of the table if no groups were selected. |
|
Deletes any selected Groups. If no groups are selected, nothing happens. |
|
Copies the selected rows or groups into the clipboard. |
|
Pastes the contents of the clipboard onto the selected rows or groups. For groups, if no destination is selected the they will be pasted as new groups at the end of the table. Rows must always be pasted onto a destination selection of the same size. |
|
Copies the selected rows, and then deletes them. |
 Expand Groups
 Collapse Groups
 Insert Row
 Delete Row
 Insert Group
 Delete Group
 Copy Rows
 Paste Rows
 Cut Rows
Keyboard Shortcuts#
The following keyboard shortcuts are available for editing in the runs table.
Shortcut |
Action |
|---|---|
|
Edit the current cell |
|
Cancel editing |
|
Next cell |
|
Previous cell |
|
Edit the next row / append a new row |
|
Insert child row |
|
Cut |
|
Copy |
|
Paste |
|
Delete the selected rows/groups |
|
Select next/previous row |
|
Extend selection to next/previous row |
|
Select all |
Search Interface#
The search interface#
Searching by Investigation ID#
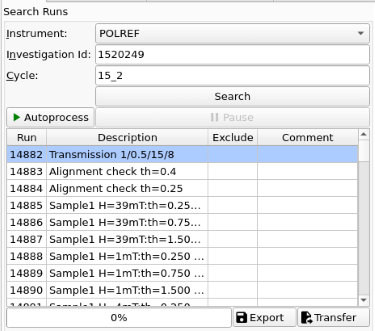
To search for runs, select the instrument the runs are from, enter the experiment ID, and optionally the cycle name, of the investigation the runs are part of, and click on Search. Providing the cycle name is currently recommended if you are on the ISIS network because this avoids the need to log in to ICat. At the time of writing, the ICat search is less reliable. However, if you are not on the ISIS network or do not know the cycle name, you will need to use the ICat search.
If any runs are found for the experiment, their run number and description will be listed in the search results table below. Note that if you enter an invalid search or if there are no runs in the experiment yet, the table will remain empty. If an experiment is currently running, you can re-run the search to check for new runs and they will be added to the results table.
When working on IDAaaS with the “Search Data Archive” setting set to “Off”, only runs that are available in the ISIS Instrument Data Cache will appear in the search results. This does not take user permissions into account. The user must still have access to these files in order to process them, otherwise a “File Not Found” error will occur when the reduction is run.
Note that some runs will be highlighted in blue. This indicates that they are not valid for reduction, e.g. transmission runs, or runs without a valid angle. Hover over the row to see a tooltip with the reason the run is invalid.
Transferring runs to the processing table#
In order to process runs they must be transferred to the main table for
processing. To transfer runs, select them in the search results table and click
the Transfer  button. You can select multiple items by holding
Ctrl or Shift while clicking with the mouse or using the up/down arrow keys.
button. You can select multiple items by holding
Ctrl or Shift while clicking with the mouse or using the up/down arrow keys.
The run number and angle will be populated in the main table. If a run’s
description contains the text th=0.7 at the end of the description then the
interface will deduce that the run’s angle (also known as theta), was 0.7,
and enter this value into the angle column for you. This holds true for any
numeric value. If the angle is not set in the description, the run will not be
valid for transfer.
Runs that need to be summed or stitched together are automatically identified and grouped as follows:
Any runs with the same description and the same theta value will be merged into a single row. The run numbers will be listed in the format
123+124+125. This indicates that they will be summed before being reduced.Any runs with the same description but a different theta value will be placed in separate rows but in the same group. This indicates that they will be stitched together after the reduction.
Rows within a group will be sorted by angle.
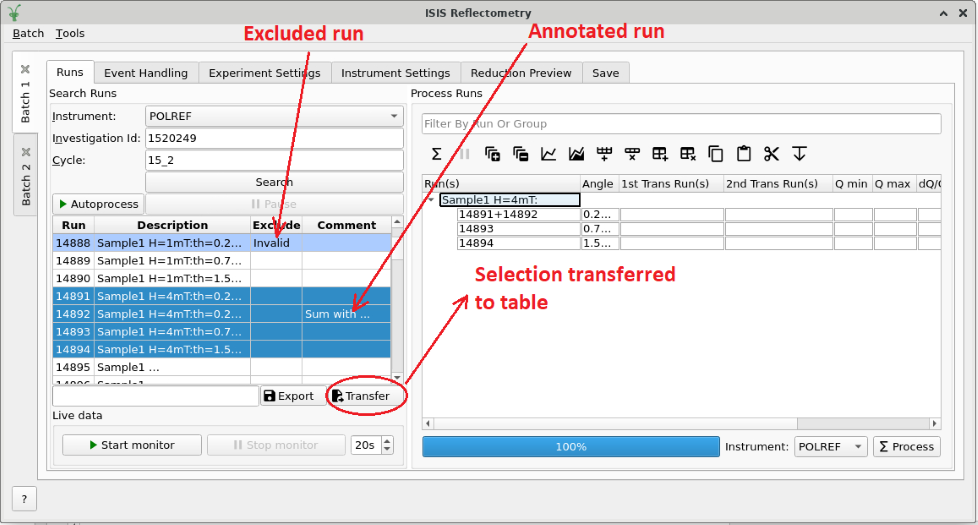
Transferring search results to the processing table#
Invalid runs#
Some runs will be highlighted in blue in the search results table. This means they are not valid for reduction, e.g. if theta was not found or is zero. This is expected for some runs, e.g. transmission runs. Hovering over a highlighted row will display the reason it is invalid.
These runs cannot be transferred to the processing table - if you attempt to transfer them they will be ignored - this means you can safely select e.g. all of the rows and be sure that only valid rows will be transferred. They will also be excluded from auto processing (see below).
Excluding and annotating runs#
You may wish to exclude certain runs from the reduction. This is especially useful for auto processing (see below). You can mark a run for exclusion by entering a reason into the Exclude column in the search results table. Double-click the cell to edit it and then press Enter or click off the cell when finished. The row will be highlighted blue to indicate that it will be excluded, similar to invalid rows. Again, a tooltip will display the reason that it is excluded.
You can also add a comment to a run without excluding it by entering text in the Comments column. This will not affect the reduction and is simply for user convenience.
To save your annotations in the Exclude and Comments columns, save the whole batch via the Batch->Save menu. You can also export the contents of the search results table to a CSV file by clicking the Export button.
Note that your annotations will be preserved if you re-run the same search or run auto-processing. However, if you change the search settings, then the existing search results, including your annotations, will be discarded. If you have warnings enabled in the Options dialog, then you will be warned before any unsaved changes are discarded.
Autoprocessing#
Starting autoprocessing#
The interface provides Autoprocessing, which allows fully automatic processing of runs for a particular investigation. This works similarly to searching for runs by investigation but takes out the manual steps for you. For more details on how searching works, see the Search Interface section.
To start autoprocessing, specify the instrument and investigation ID, and optionally the cycle name. Then click Autoprocess to start autoprocessing for this investigation. This will:
Populate the search results list with runs that are part of the investigation.
Transfer valid runs into the processing table, and begin processing them.
Periodically check for new runs.
If any new runs are found, merge them in to the main table and process them.
If the investigation has not started yet, the results list will initially be empty. However, polling will begin and runs will be found and processed as soon as they become available. Note that there may be a slight delay in the run finishing and its file becoming availble on the archive.
Invalid/excluded runs#
Runs that are not valid for reduction will not be included in autoprocessing - they will be highlighted in blue in the search results table to indicate they will be excluded. The reason will be displayed as a tooltip if you hover over the row.
You can manually exclude runs from autoprocessing by specifying an Exclude reason in the search results list. You will need to pause autoprocessing in order to edit the table. Alternatively you can do a manual search first to view and edit the results before you start autoprocessing.
During autoprocessing#
Similarly to manual processing, the Autoprocess button will be disabled while autoprocessing is in progress. If autoprocessing has been paused, the button will be enabled again. Clicking Autoprocess again will resume processing from where it left off.
Successfully reduced rows are highlighted in green in the processing table. If a group has been post-processed successfully then it is also highlighted in green. If the group only contains a single row then post-processing is not applicable, and the group will be highlighted in a paler shade of green to indicate that all of its rows have been reduced successfully but that post-processing was not performed.
If row or group processing fails, the row will be highlighted in blue in the processing table. The error message will be displayed as a tooltip if you hover over the row. Failed rows will not be reprocessed automatically, but you can manually re-process them by pausing autoprocessing, selecting the required rows, and clicking Process.
Editing the processing table#
The Processing table is not editable while autoprocessing is running but can be edited while paused. Any changes to a row that will affect the result of the reduction will cause the row’s state to be reset to unprocessed, and the row will be re-processed when autoprocessing is resumed. You can also manually process selected rows while autoprocessing is paused using the Process button.
Additional rows can be added to the table and will be processed if you restart autoprocessing. Note that if you delete rows and then start autoprocessing again, they will be re-added to the table. If you want to exclude them, you must specify an Exclude reason in the search results table.
If workspaces are deleted while autoprocessing is running, or before resuming autoprocessing, then affected rows/groups will be reprocessed if their mandatory output workspaces no longer exist. If you do not want a row/group to be reprocessed, then you must first remove it from the table. Deleting interim workspaces such as IvsLam will not cause rows to be reprocessed.
Changing the instrument or search criteria while paused and then clicking Autoprocess will start a completely new autoprocessing operation. The search results and processing table will be cleared and populated with the new results. If you have warnings enabled in the Options, you will be warned if this will cause unsaved changes to be lost.
Live Data Monitoring#
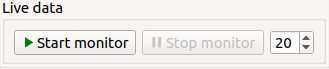
The live data section#
The Live data section on the Runs tab allows you to start a monitoring algorithm that will periodically load live data from the instrument, given by the update interval spin box, and reduce it with ReflectometryReductionOneAuto. It outputs two workspaces, TOF_live for the original data and IvsQ_binned_live for the reduced data.
Live values for ThetaIn and the slit gaps are checked and used each time the reduction runs. Other algorithm properties are taken from Group 1 on the Settings tab. Make any changes you want to the settings and press Start monitor to begin monitoring. Note that any changes to the settings will not be updated in the live data reduction unless you stop and re-start monitoring.
You can stop monitoring at any time using the Stop monitor button or by cancelling the algorithm from the Algorithm progress dialog. If you close the interface, monitoring will continue running in the background. You can cancel the MonitorLiveData algorithm from the Algorithm progress dialog.
If MonitorLiveData stops due to an error, the Start monitor button will be re-enabled so that it can be re-started from the Interface.
Note that if you close and re-open the Interface, the link to any running monitor algorithm will be lost. You will not be able to start a new version of the monitor due to a clash in the output names. Stop the algorithm from the Algorithm process dialog and re-start it from the new instance of the Interface to re-link it.
Live data monitoring has the following requirements:
CaChannel must be installed in Mantid. See the instructions here.
The instrument must be on IBEX or have additional processes installed to supply the EPICS values.
If it does not, you will get an error that live values could not be found for Theta and the slits.
Event Handling Tab#
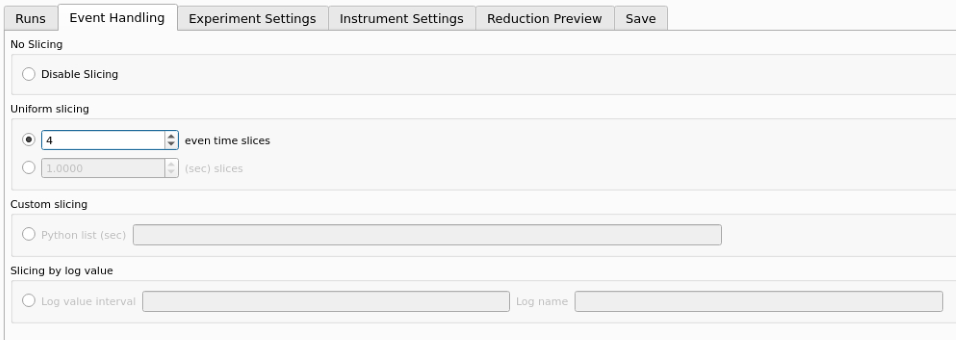
The event handling tab#
The Event Handling tab can be used to analyze event workspaces. It contains four text boxes for specifying uniform even, uniform, custom and log value slicing respectively. Each of these slicing options are exclusive, no more than one can be applied. If the text box for the selected slicing method is empty no event analysis will be performed, runs will be loaded using LoadISISNexus and analyzed as histogram workspaces. When this text box is not empty, runs will be loaded using LoadEventNexus and the interface will try to parse the user input to obtain a set of start and stop values. These define different time slices that will be passed on to the filtering algorithms (GenerateEventsFilter and FilterEvents). Each time slice will be normalized by the total proton charge and reduced as described in the previous section. Note that, if any of the runs in a group could not be loaded as an event workspace, you will get an error message and the reduction will not be performed.
The four slicing options are described in more detail below:
Uniform Even - The interface obtains the start and end times of the run and divides it into a specified number of evenly-sized slices. For example given a run of duration 100 seconds, specifying 4 uniform even slices will produce slices with ranges of
0 - 25,25 - 50,50 - 75and75 - 100seconds respectively.Uniform - The interface obtains the start and end times of the run and divides it into several slices of a specified duration. If the total duration does not divide evenly by the slice duration, then the last slice will be shorter than the others. For example, given a run of duration 100 seconds, specifying slices of duration 30 seconds will produce slices with ranges of
0 - 30,30 - 60,60 - 90and90 - 100seconds respectively.Custom - This takes a list of comma-separated numbers, giving a sequence of intervals that is applied repeatedly to slice the entire run. For example, given a run of duration 100 seconds, specifying custom slicing of
10, 20, 30will produce slices with ranges of0 - 10,10 - 30,30 - 60,60 - 70,70 - 90and90 - 100seconds.LogValue - This takes a single value which is the log value interval, and also the log name which is the name of the log we wish to filter the run for. For example, given a run and entries of
100andproton_chargefor slicing values and log name respectively, we would produce a number of slices each with interval100.
Workspaces will be named with a suffix providing information about the slice, e.g
IvsQ_13460_slice_50_75, IvsQ_13460_slice_75_100, etc.
Experiment and Instrument Settings Tabs#
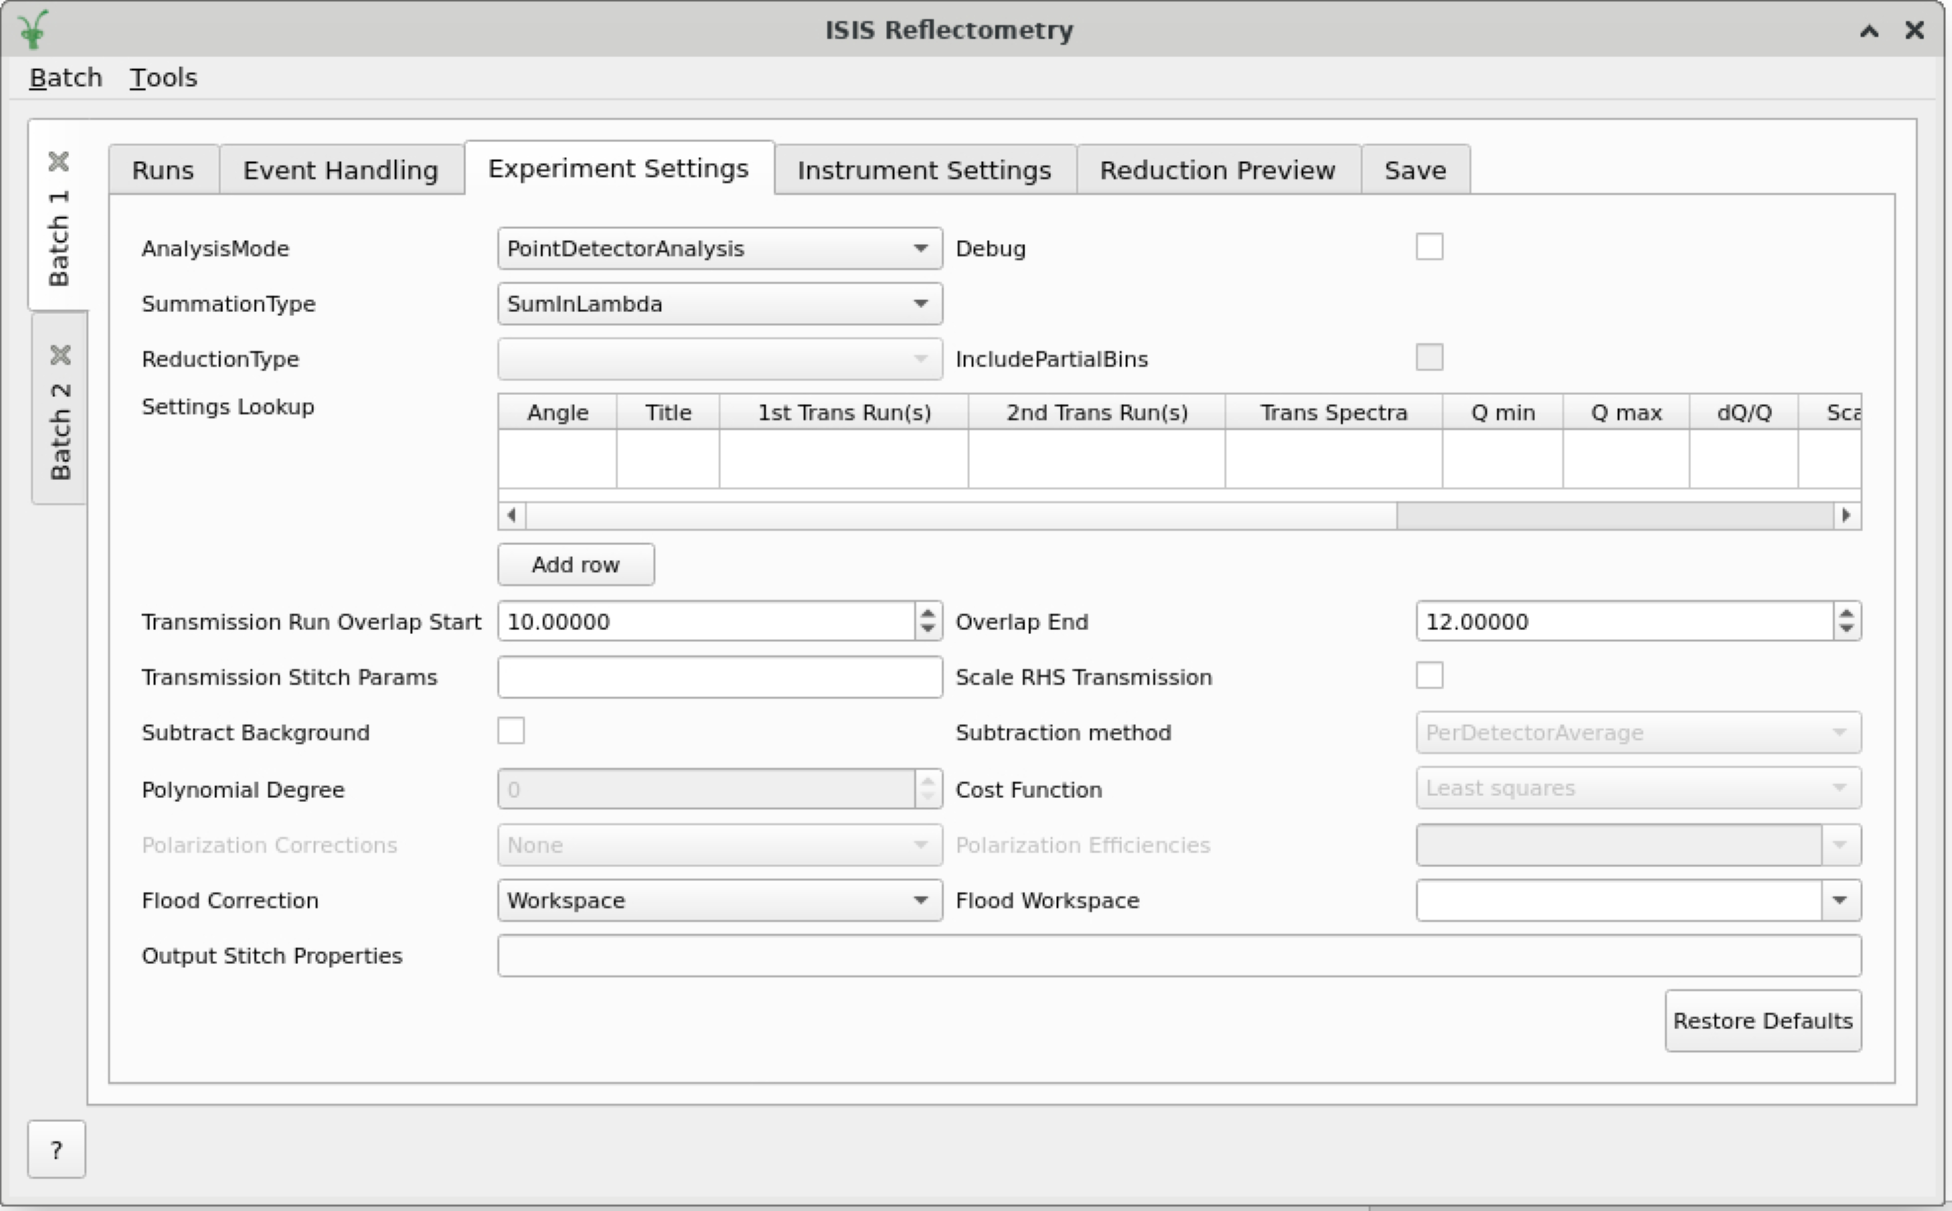
The experiment Settings tab#
The Experiment Settings and Instrument Settings tabs can be used to specify options for the reduction and post-processing releting to a specific experiment. The Experiment settings are variables that are mostly set by the user, whereas the Instrument Settings are variables relating to the instrument used to perform the reduction. Both are populated with default values for the current instrument. The Restore Defaults button allows you to revert the settings to the default values for the instrument.
The majority of these options are used by the interface to provide argument values for the pre-processing and reduction steps, which are handled by the algorithm: ReflectometryISISLoadAndProcess
The exception is Output Stitch Params, which is used for the final
stitching done by the algorithm Stitch1DMany. Note
however that if a bin width is not provided, for instance Params="-0.03",
then -dQ/Q will be used, if specified; otherwise a default value will be
calculated from the slits, if possible.
Note that when conflicting options are specified for the reduction, i.e. different values for the same property are specified via one of the settings tabs and the cells in the Runs tab, the latter will take precedence. Therefore, the Settings tabs should be used to specify global options that will be applied to all the rows in the table, whereas the row values will only be applicable to the specific row for which those options are defined.
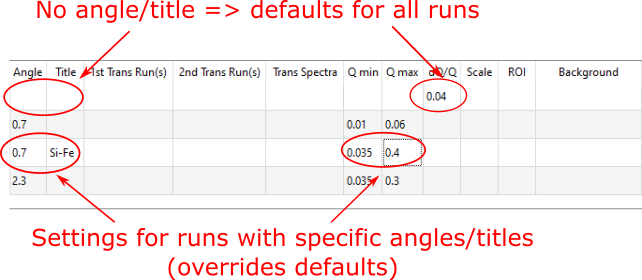
Sample and angle lookup table#
The Experiment Settings tab allows some options to be specified in a lookup
table that will be applied to runs that match certain search criteria, namely the
angle, and optionally also the run title. Matching angles are searched for within
a tolerance of 0.01. The title field on the lookup table is a regular expression.
In the lookup table, you can also specify a “wildcard” row, which will apply to all runs that don’t also have a matching angle/title - just leave the angle and title blank to create a wildcard row. Only one wildcard row may exist.
The lookup table on the Experiment Settings tab#
Entries in the lookup table are similar to the table on the Runs tab. Hover over a table cell to see a tooltip describing what the value is for.
Default transmission runs can be specified and each input can take a
single run/workspace or a number of runs/workspaces that will be summed before
processing. Specific spectra of interest can be specified for the input runs
and separate spectra, if required, can be specified for the transmission runs -
if the latter are not specified then the ROI will also be used for
the transmission runs. If both a First and Second tranmission input is
specified, then they will be stitched using the options specified.
When polarization corrections are enabled, the Input SpinState Order field can be used to specify the
order of the input workspace group. For Fredrikze corrections use spin states such as pa, ap, pp, aa.
For Wildes corrections use the flipper configuration, such as 00, 01, 10, 11 or 0, 1. Leave the
field empty to use the default from the instrument parameter file or correction algorithm. If the input uses
Fredrikze spin states while Wildes correction is selected, or Wildes spin states while Fredrikze correction is
selected, the reduction reports this mismatch.
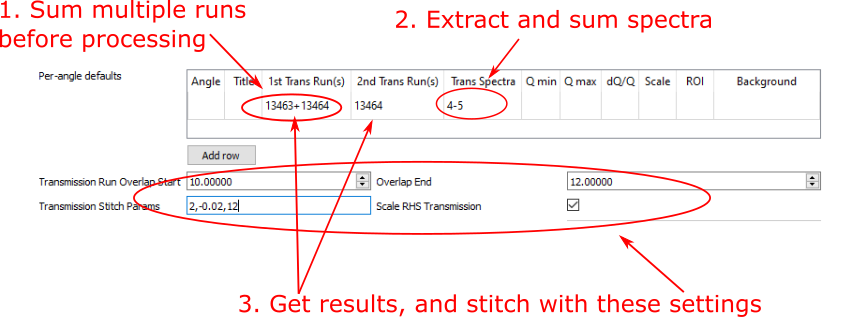
Transmission run options#
Reduction Preview Tab#
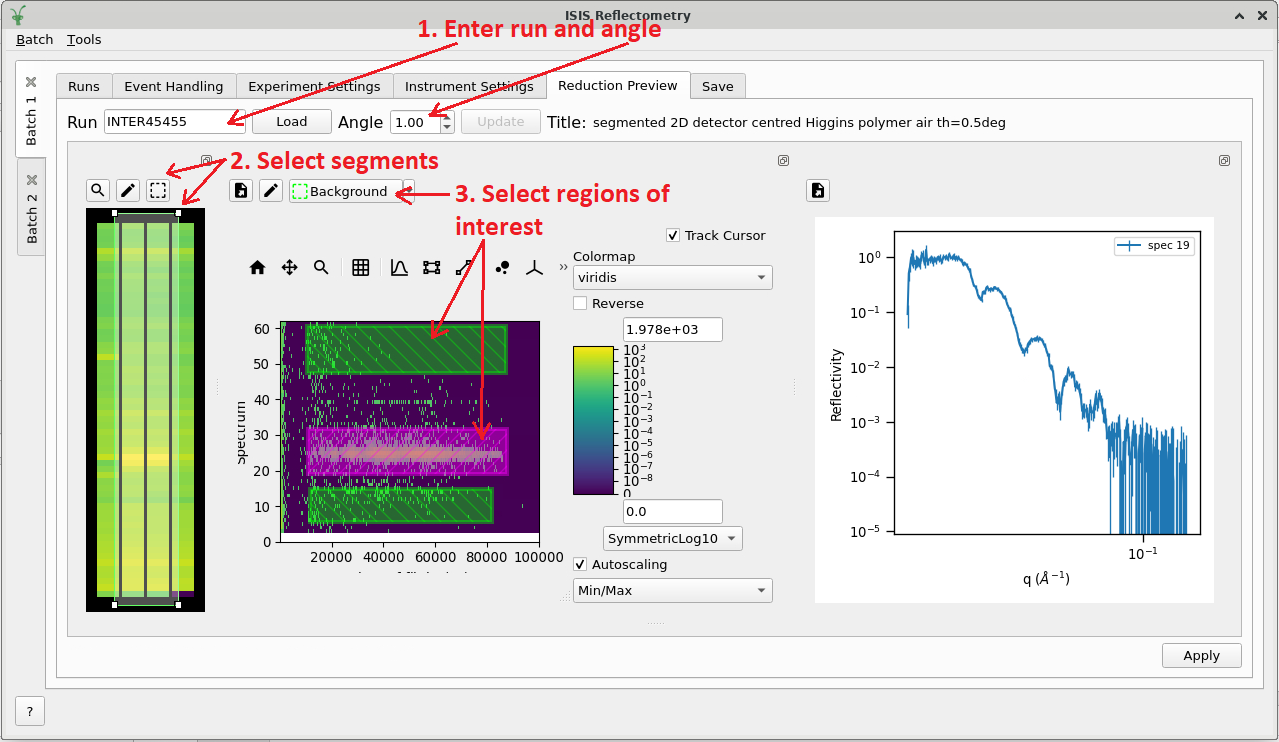
The reduction preview tab#
The preview tab provides a graphical tool for the selection of various regions of interest, and allows you to see the effect of those selections on the reduced reflectivity curve.
Typical usage of the tool is as follows:
Enter a run number and angle.
The run is loaded, and a plot of the workspace is displayed, with pre-processing (e.g. calibration) applied.
For 2D detectors, a detector image is displayed
For linear detectors, a Spectrum vs TOF plot is displayed
2D Detectors only: select a region of interest on the detector image.
The selected detectors are summed across segments, and a plot of Spectrum vs TOF plot is displayed.
Select one or more regions of interest on the TOF plot.
A full reduction is run using the selected regions, and a plot of the final reflectivity curve is displayed.
Adjust the regions of interest until you are happy with the reflectivity curve.
Click the Apply button to save the regions of interest into the batch settings.
This will overwrite the settings on the lookup table in the Experiment Settings tab so that they can be applied to a batch reduction or saved to a batch file.
All other settings for the preprocessing/reduction are taken from the interface, so the reduction preview will perform exactly the same reduction as a normal batch reduction, aside from the regions of interest that you have overridden using the graphical selection tool.
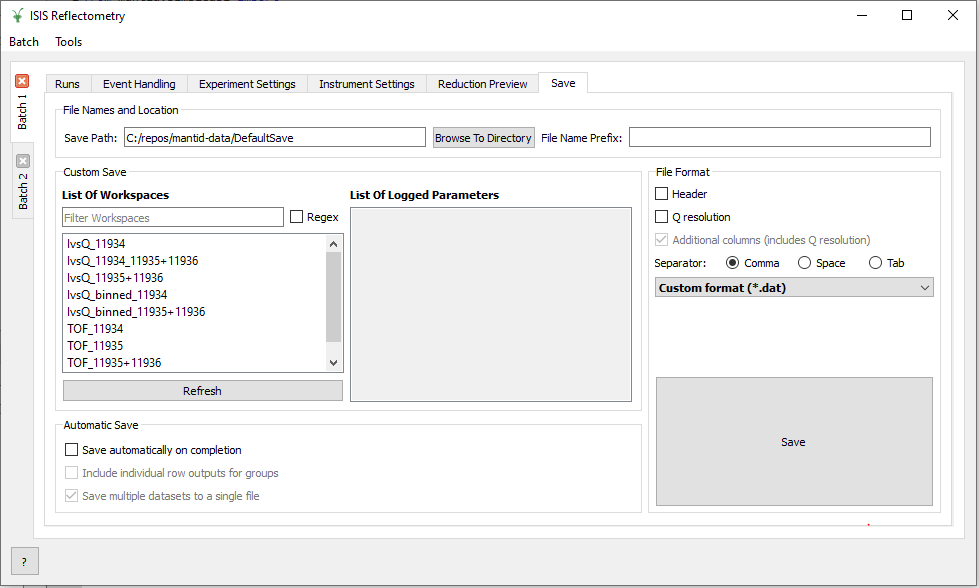
Save Tab#
The Save tab allows for processed workspaces to be saved in specific formats. The filenames are saved in the form [Prefix][Workspace Name].[ext]. See SaveReflectometryAscii v1 and SaveISISReflectometryORSO v1 for a description of the supported formats.
The save tab#
Name |
Description |
|---|---|
Save path |
At present this dialog doesn’t have a standard file dialog so that path must be filled in manually. The path must already exist as this dialog doesn’t have the ability to create directories. As the naming of files is automatic, the path must also point to a directory rather than a file. |
Prefix |
The prefix is what is added to the beginning of the workspace name to create the file name. No underscore or space is added between them so they must be manually added. |
Filter |
This can be specified to filter out workspaces in the workspace list whose name does not match that of the filter text. |
Regex |
Checking this option allows a regular expression to be used for filtering workspace names. |
List Of Workspaces |
The left listbox will contain any workspaces loaded into mantid (excluding group and table workspaces). Double clicking on one will fill the right list box with the parameters it contains. This listbox supports multi-select in order to allow for multiple workspaces to be saved out at the same time with the same settings. |
List Of Logged Parameters |
The right listbox starts out empty, but will fill with parameter names when a workspace in the left listbox is double clicked. This listbox supports multi-select in order to allow for the save output to contain multiple parameter notes. |
File format |
This dialog can save to ANSTO, ILL cosmos, 3-column, ORSO Ascii, ORSO Nexus and a customisable format. It doesn’t save from the main interface’s table, but from workspaces loaded into mantid. All algorithms are also available as save algorithms from mantid itself. |
Custom Format Options |
When saving in ‘Custom’ this section allows you to specify if you want a Header and/or Q Resolution column as well as specifying the delimiter. |
ORSO Format Options |
You can save into either the ORSO Ascii or ORSO Nexus
format. For either format, you can specify whether to
include a Q Resolution column. You can also use the
|
Automatic Save |
Automatically save the main output workspace for
groups in the runs table. Note that the stitched
group output will be saved if there is one or, for
a single-row group, the |
Troubleshooting#
When I try to process I get an error: “Invalid value for property Filename (list of str lists) …”#
This occurs when Mantid is unable to load a run. If the run was given as a workspace name, check the spelling. If the run was given as a number, check that the run number is correct. If the run number is incorrect, check the number given in the Run(s) or Transmission Run(s) columns. If the run number is correct, check the instrument named in the error message is correct. If the instrument is incorrect, check that the processing instrument selector (at the bottom right of the interface) is correct.
If the run still isn’t loading check Mantid’s user directories are set correctly, and that the desired run is in one of the given directories. To manage the user directories, open File -> Manage User Directories.
When I try to process I get an error: “Error encountered while stitching group …”#
This occurs when Mantid is unable to stitch a group. Please check that at you have
specified at least the bin width. This can be done either by setting a value in column
dQ/Q before processing the data, or by using the Output Stitch Params text
box in the Experiment Settings tab to provide the Params input property like this:
Params="-0.03" (you may want to replace 0.03 with a bin size suitable for
your reduction). Note that the “-” sign in this case will produce a logarithmic binning in the
stitched workspace. For linear binning, use Params="0.03".
When I try to process I get an error: “Invalid key value pair, ‘…’”#
This occurs when the contents of the options column are invalid.
Key value pairs must be given in the form key = value, and if the value
contains commas it must be quoted, like so: key = "v,a,l,u,e".
When I try to process I get an error: “Invalid value for property … Can not convert “False/True” to boolean”#
This occurs when a boolean property is set to “True” or “False”. Please, use 1 or 0 instead.
My IvsQ workspaces are not being stitched correctly#
Stitching is controlled by the group a row is in. For stitching to occur, the rows must be in the same group, and be processed simultaneously. To select all rows in a group, just select the group itself - its child rows are implicitly selected.
Categories: Interfaces | Reflectometry