UI & Usability Changes#
User Interface#
Project Saving#
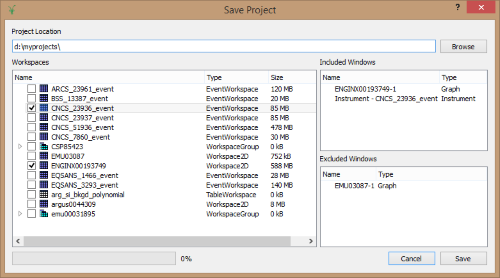
We have added a new dialog when saving a project that allows you to select which workspaces you want to save, and will tell you which graph windows will be included or excluded based on your selections.
The size of each workspace in memory is listed so you can speed up project saving (and reloading) by excluding large workspaces you do not need.
Windows#
Close All Graph Windows#
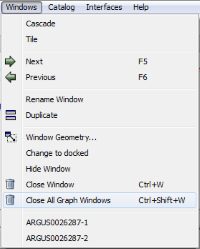
If you have lots of windows that you want to close, there is now an option to close all of the windows of a certain type in one go in the window menu. The type of window is based on the selected window, so to close all graph windows, just click on a graph window and go to
Windows->Close All Graph Windows. The option will only appear if you have more than one of that type of window.
Instrument View#
New peak comparison tool on the pick tab. The user can select two peaks and information relating to their properties and the angles between them.
New tool for computing in-plane and out-of-plane angles in Qlab space for crystal alignment.
Added the ability to drag and drop mask workspaces onto the instrument view. This will apply the store workspace to the view.
Added the ability to store masking/ROI/grouping shapes to a table workspace, which can be dragged & dropped back onto different instrument views.
Plotting Improvements#
Fixed a bug where left and right Y axes went out of sync when a fit was run.
Exposed the
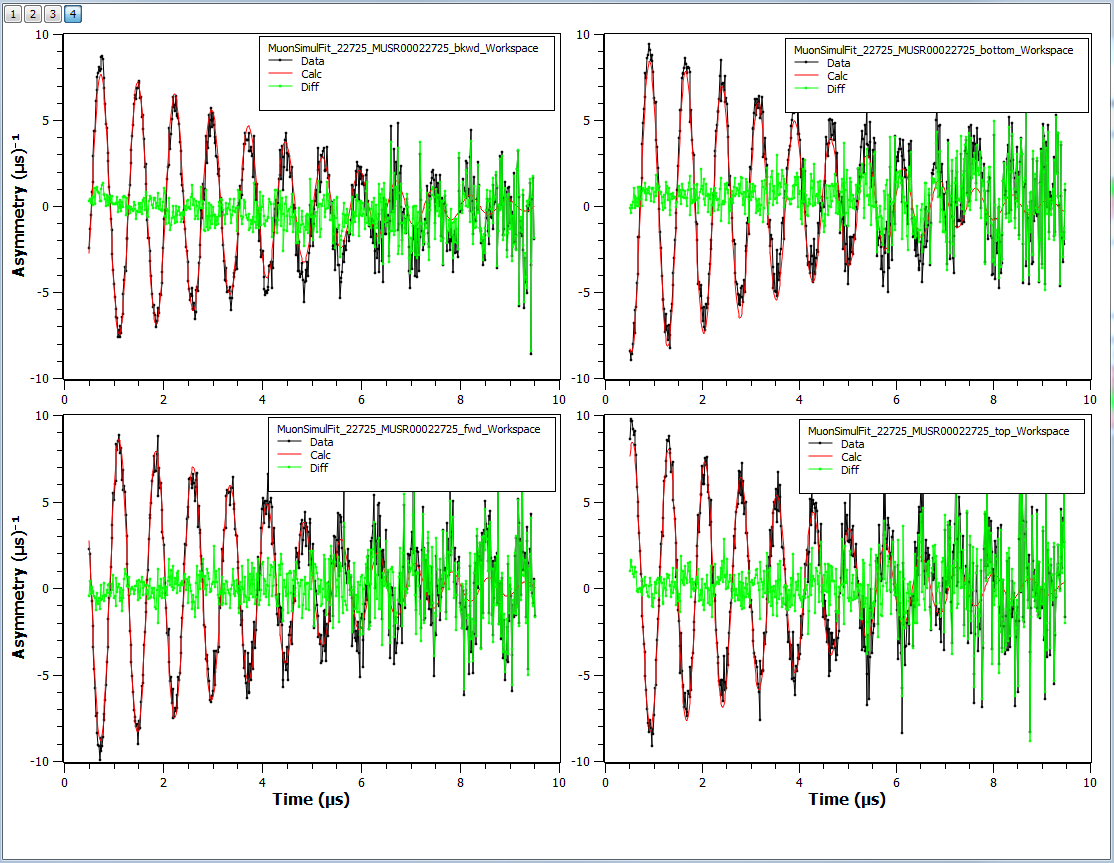
plotSubplotscommand to Python. This creates a tiled (multilayer) plot with one workspace per tile.
plotSubplots#
Algorithm Toolbox#
Added compressorType option to
SaveMDWorkspaceToVTK.
Python#
ParaView’s python scripting interface is available from within MantidPlot and mantidpython. Type from paraview.simple import * to get started. Additional documentation is available here
Custom Interfaces#
Indirect Data Reduction (facility ILL, instrument IN16B) is face-lifted to incorporate the new reduction algorithms options.
SliceViewer Improvements#
SliceViewer with nonorthogonal view#
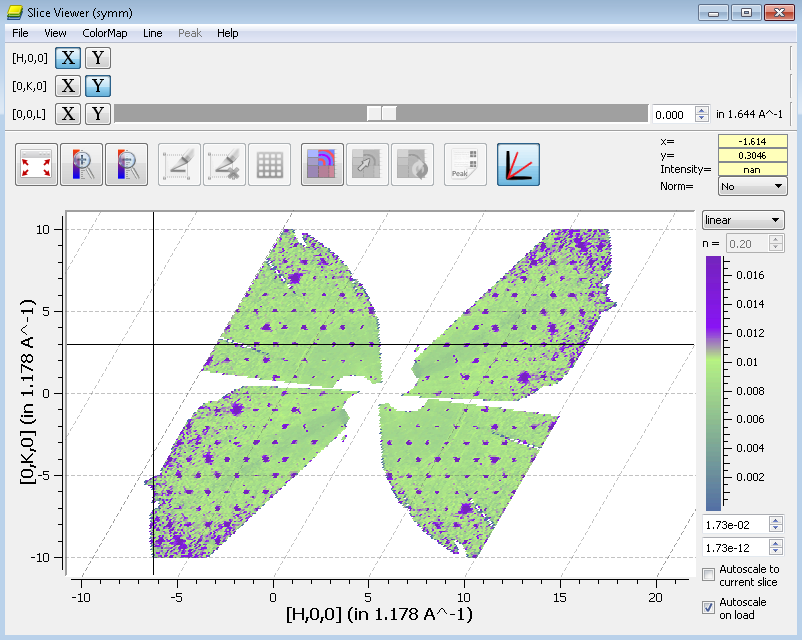
Added the ability to view data using non orthogonal axes. View can be toggled on or off. When non orthogonal view is toggled the peak viewer and line viewer tools are disabled.
Setting the thickess now means that the slicing happens between -0.5*thicness+center and +0.5*thicness+center, instead of -thicness+center and +thicness+center. For the LineViewer, the python setPlanarWidth and getPlanarWidth are still having the old behavior, but the constructor is fixed.
VSI Improvements#
ParaView updated to v5.2.0
The sources and views more reliably show progress in the VSI status bar.
Added a button to the standard view which applies the threshold filter.
Update the cut button to match the equivalent ParaView icon.
Changed the fallback for when MDHistoworkspace was opened in the (incompatible) SplatterPlot view to the MultiSlice view.
Faster initial loading of a MDHistoworkspace in the MultiSlice and ThreeSlice view.
Drawing of a MDHistoWorkspace is now carried out in parallel using vtkSMPTools.
Bugs Resolved#
Fixed a bug where checking or unchecking “show invisible workspaces” in View->Preferences->Mantid->Options would have no effect on workspaces loaded in the dock.
The Spectrum Viewer now reports two theta and azimuthal angle correctly.
Fixed crash when clicking “Help->Ask for Help” on Linux-based systems with Firefox set as the default browser.
The “Filter log values by” option in the Sample Logs dialog now works out the log statistics with the correct filter applied, and deals correctly with aborted runs.
Fixed crash when loading data and the algorithm widget is hidden.
Fixed exception being thrown when saving a project with custom interfaces open.
The “Plot Surface from Group” and “Plot Contour from Group” options have been fixed and now work for both histogram and point data. Note that all workspaces in the group must have the same X data.
Fixed a bug where enabling auto rebinning in the slice viewer and zooming would not rebin the workspace if it was a histogram workspace.
Fixed importing string logs and string series logs into MantidPlot
Legend placement has been fixed in the “tiled plot”/
plotSubplotsoption, and these graphs now use Mantid’s default plot style options.Fixed a bug where saving a plot created from columns of a table window are loaded back as a blank plot from a Mantid project.
Fixed a bug where saving a tiled plot to a project file, would be reloaded with different size plots when opened.
Fixed a bug where minimised windows would not stay minimised after being serialised to a Mantid project
Fixed a bug where changing the integration range of the instrument view would clear the applied zooming.
Fixed a bug where the threshold filter in the VSI SplatterPlot view only returned an empty dataset.
Fixed a bug where plotting a column of TableWorkspace in the GUI did not work if decimal separator was not a dot.
Fixed a bug where closing a second plot window would cause a newly activated window to be resized.
Fixed a bug where pressing the pick mode button in the SplatterPlotView of the VSI caused Mantid to crash.
Full list of GUI and Documentation changes on GitHub