\(\renewcommand\AA{\unicode{x212B}}\)
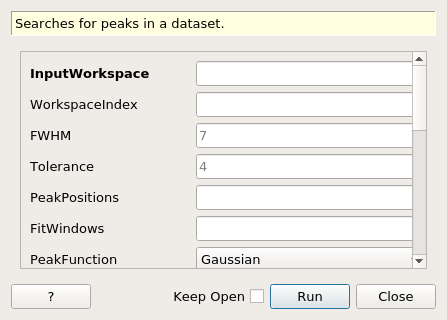
FindPeaks dialog.
Table of Contents
| Name | Direction | Type | Default | Description |
|---|---|---|---|---|
| InputWorkspace | Input | MatrixWorkspace | Mandatory | Name of the workspace to search |
| WorkspaceIndex | Input | number | Optional | If set, only this spectrum will be searched for peaks (otherwise all are) |
| FWHM | Input | number | 7 | Estimated number of points covered by the fwhm of a peak (default 7) |
| Tolerance | Input | number | 4 | A measure of the strictness desired in meeting the condition on peak candidates, Mariscotti recommends 2 (default 4) |
| PeakPositions | Input | dbl list | Optional: enter a comma-separated list of the expected X-position of the centre of the peaks. Only peaks near these positions will be fitted. | |
| FitWindows | Input | dbl list | Optional: enter a comma-separated list of the expected X-position of windows to fit. The number of values must be exactly double the number of specified peaks. | |
| PeakFunction | Input | string | Gaussian | Allowed values: [‘BackToBackExponential’, ‘Bk2BkExpConvPV’, ‘DeltaFunction’, ‘ElasticDiffRotDiscreteCircle’, ‘ElasticDiffSphere’, ‘ElasticIsoRotDiff’, ‘ExamplePeakFunction’, ‘Gaussian’, ‘IkedaCarpenterPV’, ‘Lorentzian’, ‘PseudoVoigt’, ‘Voigt’] |
| BackgroundType | Input | string | Linear | Type of Background. Allowed values: [‘Flat’, ‘Linear’, ‘Quadratic’] |
| HighBackground | Input | boolean | True | Relatively weak peak in high background |
| MinGuessedPeakWidth | Input | number | 2 | Minimum guessed peak width for fit. It is in unit of number of pixels. |
| MaxGuessedPeakWidth | Input | number | 10 | Maximum guessed peak width for fit. It is in unit of number of pixels. |
| GuessedPeakWidthStep | Input | number | 2 | Step of guessed peak width. It is in unit of number of pixels. |
| PeakPositionTolerance | Input | number | Optional | Tolerance on the found peaks’ positions against the input peak positions. Non-positive value indicates that this option is turned off. |
| PeaksList | Output | TableWorkspace | Mandatory | The name of the TableWorkspace in which to store the list of peaks found |
| RawPeakParameters | Input | boolean | False | false generates table with effective centre/width/height parameters. true generates a table with peak function parameters |
| MinimumPeakHeight | Input | number | 2.2250738585072014e-308 | Minimum allowed peak height. |
| MinimumPeakHeightObs | Input | number | 0 | Least value of the maximum observed Y value of a peak within specified region. If any peak’s maximum observed Y value is smaller, then this peak will not be fit. It is designed for EventWorkspace with integer counts. |
| CostFunction | Input | string | Chi-Square | Cost functions. Allowed values: [‘Chi-Square’, ‘Rwp’] |
| Minimizer | Input | string | Levenberg-MarquardtMD | Minimizer to use for fitting. Minimizers available are “Levenberg-Marquardt”, “Simplex”,”Conjugate gradient (Fletcher-Reeves imp.)”, “Conjugate gradient (Polak-Ribiere imp.)”, “BFGS”, and “Levenberg-MarquardtMD”. Allowed values: [‘BFGS’, ‘Conjugate gradient (Fletcher-Reeves imp.)’, ‘Conjugate gradient (Polak-Ribiere imp.)’, ‘Damped GaussNewton’, ‘FABADA’, ‘Levenberg-Marquardt’, ‘Levenberg-MarquardtMD’, ‘Simplex’, ‘SteepestDescent’, ‘Trust Region’] |
| StartFromObservedPeakCentre | Input | boolean | True | Use observed value as the starting value of peak centre. |
This algorithm searches the specified spectra in a workspace for peaks,
returning a list of the found and successfully fitted peaks. The search
algorithm is described in full in reference [1]. In summary: the second
difference of each spectrum is computed and smoothed. This smoothed data
is then searched for patterns consistent with the presence of a peak.
The list of candidate peaks found is passed to a fitting routine and
those that are successfully fitted are kept and returned in the output
workspace (and logged at information level). The output
TableWorkspace contains columns,
which reflect the fact that the peak has been fitted to a peak function atop
a background: spectrum, centre, width, height, backgroundintercept and
backgroundslope. Setting RawPeakParameters=True will give the actual
peak fit parameters rather than this abstraction.
FindPeaks uses the SmoothData v1 algorithm to, well, smooth the data - a necessary step to identify peaks in statistically fluctuating data. The Fit v1 algorithm is used to fit candidate peaks.
FindPeaks uses a more complicated approach to fit peaks if HighBackground is flagged. In this case, FindPeak will fit the background first, and then do a Gaussian fit the peak with the fitted background removed. This procedure will be repeated for a couple of times with different guessed peak widths. And the parameters of the best result is selected. The last step is to fit the peak with a combo function including background and Gaussian by using the previously recorded best background and peak parameters as the starting values.
FindPeaks finds peaks by fitting a Gaussian with background to a certain range in the input histogram. Fit v1 may not give a correct result even if chi^2 is used as criteria alone. Thus some other criteria are provided as options to validate the result
If FitWindows is defined, then a peak’s range to fit (i.e., x-min and x-max) is confined by this window.
If FitWindows is defined, starting peak centres are NOT user’s input, but found by highest value within peak window. (Is this correct???)
If FindPeaksBackground fails, then it is necessary to estimate a rough peak range and background according to observed data.
See also
The list of available functions for details on the various functions and the documentation for minimizers.
Example - Find a single peak:
ws = CreateSampleWorkspace(Function="User Defined", UserDefinedFunction="name=LinearBackground, \
   A0=0.3;name=Gaussian, PeakCentre=5, Height=10, Sigma=0.7", NumBanks=1, BankPixelWidth=1, XMin=0, XMax=10, BinWidth=0.1)

table = FindPeaks(InputWorkspace='ws', FWHM='20')

row = table.row(0)

print("Peak 1 {Centre: %.3f, width: %.3f, height: %.3f }" % ( row["centre"],  row["width"], row["height"]))
Output:
Peak 1 {Centre: 5.050, width: 1.648, height: 10.000 }
Categories: AlgorithmIndex | Optimization\PeakFinding