\(\renewcommand\AA{\unicode{x212B}}\)
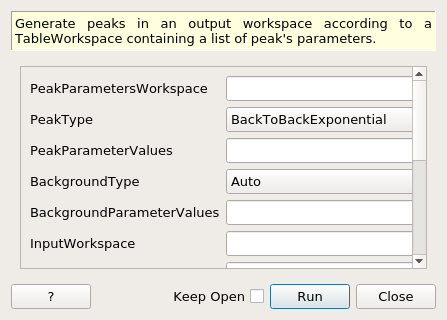
GeneratePeaks dialog.
Table of Contents
Generate peaks in an output workspace according to a TableWorkspace containing a list of peak’s parameters.
| Name | Direction | Type | Default | Description |
|---|---|---|---|---|
| PeakParametersWorkspace | Input | TableWorkspace | Input TableWorkspace for peak’s parameters. | |
| PeakType | Input | string | Mandatory | Peak function type. Allowed values: [‘BackToBackExponential’, ‘BackToBackExponential (I, A, B, X0, S)’, ‘Bk2BkExpConvPV’, ‘Bk2BkExpConvPV (X0, Intensity, Alpha, Beta, Sigma2, Gamma)’, ‘DeltaFunction’, ‘DeltaFunction (Height, Centre)’, ‘ElasticDiffRotDiscreteCircle’, ‘ElasticDiffRotDiscreteCircle (Height, Centre, Radius)’, ‘ElasticDiffSphere’, ‘ElasticDiffSphere (Height, Centre, Radius)’, ‘ElasticIsoRotDiff’, ‘ElasticIsoRotDiff (Height, Centre, Radius)’, ‘ExamplePeakFunction’, ‘ExamplePeakFunction (Height, PeakCentre, Sigma)’, ‘Gaussian’, ‘Gaussian (Height, PeakCentre, Sigma)’, ‘IkedaCarpenterPV’, ‘IkedaCarpenterPV (I, Alpha0, Alpha1, Beta0, Kappa, SigmaSquared, Gamma, X0)’, ‘Lorentzian’, ‘Lorentzian (Amplitude, PeakCentre, FWHM)’, ‘PseudoVoigt’, ‘PseudoVoigt (Mixing, Intensity, PeakCentre, FWHM)’, ‘Voigt’, ‘Voigt (LorentzAmp, LorentzPos, LorentzFWHM, GaussianFWHM)’] |
| PeakParameterValues | Input | dbl list | List of peak parameter values. They must have a 1-to-1 mapping to PeakParameterNames list. | |
| BackgroundType | Input | string | Mandatory | Type of Background. Allowed values: [‘Auto’, ‘Flat (A0)’, ‘Linear (A0, A1)’, ‘Quadratic (A0, A1, A2)’, ‘FlatLinear’, ‘Quadratic’] |
| BackgroundParameterValues | Input | dbl list | List of background parameter values. They must have a 1-to-1 mapping to PeakParameterNames list. | |
| InputWorkspace | Input | MatrixWorkspace | InputWorkspace (optional) to take information for the instrument, and where to evaluate the x-axis. | |
| WorkspaceIndex | Input | number | 0 | Spectrum of the peak to be generated. It is only applied to the case by input parameter values in vector format. |
| BinningParameters | Input | dbl list | A comma separated list of first bin boundary, width, last bin boundary. Optionally this can be followed by a comma and more widths and last boundary pairs. Negative width values indicate logarithmic binning. | |
| NumberWidths | Input | number | 2 | Number of peak width to evaluate each peak for. Default=2. |
| OutputWorkspace | Output | MatrixWorkspace | Mandatory | Output Workspace to put the calculated data. |
| GenerateBackground | Input | boolean | True | Whether or not to generate the background |
| MaxAllowedChi2 | Input | number | 100 | Maximum chi^2 of the peak allowed to calculate. Default 100. |
| IgnoreWidePeaks | Input | boolean | False | If selected, the peaks that are wider than fit window (denoted by negative chi^2) are ignored. |
| IsRawParameter | Input | boolean | True | Flag to show whether the parameter table contains raw parameters. In the case that parameter values are input via vector, and this flag is set to false, the default order of effective peak parameters is centre, height and width; the default order of effective background parameters is A0, A1 and A2. |
Generate a workspace by summing over the peak functions and optionally background functions. The peaks’ and background’ parameters are either (1) given in a TableWorkspace or (2) given by an array of doubles.
There are 2 different approaches to input parameter values of peak and background function.
Peak and background parameters must have the following columns, which are case sensitive in input TableWorkspace
The definition of this table workspace is consistent with the output peak and background parameter TableWorkspace of algorithm FindPeaks.
The following table contains the effective peak and background parameters.
| Column | Name | Comment |
|---|---|---|
| 1 | spectrum | |
| 2 | centre | |
| 3 | height | |
| 4 | width | FWHM |
| 5 | backgroundintercept | A0 |
| 6 | backgroundslope | A1 |
| 7 | A2 | A2 |
| 8 | chi2 |
An alternative way to input function parameters is to specify parameter values in property ‘PeakParameterValues’ and ‘BackgroundParameterValues’.
In this case, there is only one peak function that can be specified and generated.
The order of the parameters are pre-determined, which can be found in the dropdown list of ‘PeakType’ and ‘BackgroundType’. For example in ‘PeakType’, there is an item named ‘Gaussian(Height,PeakCentre, Sigma)’. Therefore, the order of parameters for Gaussian is height, peak centre and sigma. It does not matter whether ‘Gaussian’ or ‘Gaussian(Height,PeakCentre, Sigma)’ is selected.
GeneratePeak supports effective peak and background parameters.
For peak parameters, the effective parameters are centre, height and FWHM. This order must be followed if the parameter values are input through ‘PeakParameterValues’.
For background parameters, the effective parameters are interception, slope and A2. This order must be followed if the parameter values are input through ‘BackgroundParameterValues’.
params = CreateEmptyTableWorkspace()
params.addColumn("int", "spectrum")
params.addColumn("double", "Height")
params.addColumn("double", "PeakCentre")
params.addColumn("double", "Sigma")
params.addColumn("double", "A0")
params.addColumn("double", "A1")
params.addColumn("double", "chi2")
# match array example below
params.addRow([3, 10.0, 1, 0.2, 5.0, 1.0, 0.01])
fromtable = GeneratePeaks(PeakParametersWorkspace=params, PeakType='Gaussian', BackgroundType='Linear (A0, A1)',
                          BinningParameters='0,0.01,20', NumberWidths=5)

for i in [92,93,94,95]:
    print("X = {:.6f}, Y = {:.6f}".format(fromtable.readX(0)[i], fromtable.readY(0)[i]))
Output:
X = 0.920000, Y = 15.151163
X = 0.930000, Y = 15.335881
X = 0.940000, Y = 15.499975
X = 0.950000, Y = 15.642332
GeneratePeaks(PeakType='Gaussian (Height, PeakCentre, Sigma)', PeakParameterValues='10,1,0.2',
    BackgroundType='Linear (A0, A1)', BackgroundParameterValues='5,1',
    BinningParameters='0,0.01,20', NumberWidths=5, OutputWorkspace='GaussianPeak')

outws = mtd["GaussianPeak"]
for i in [92,93,94,95]:
    print("X = {:.6f}, Y = {:.6f}".format(outws.readX(0)[i], outws.readY(0)[i]))
Output:
X = 0.920000, Y = 15.151163
X = 0.930000, Y = 15.335881
X = 0.940000, Y = 15.499975
X = 0.950000, Y = 15.642332
Categories: AlgorithmIndex | Crystal\Peaks