3D Plots: Surface and Wireframe#
Other Plot Types
General Plot Help
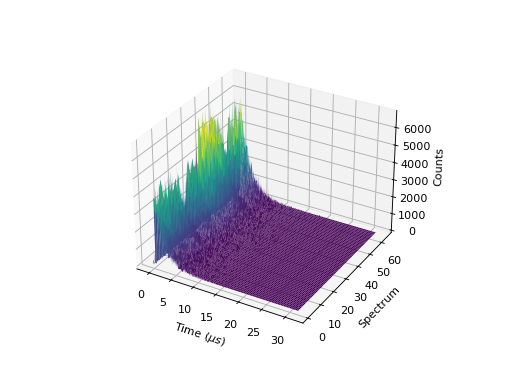
Surface Plots#
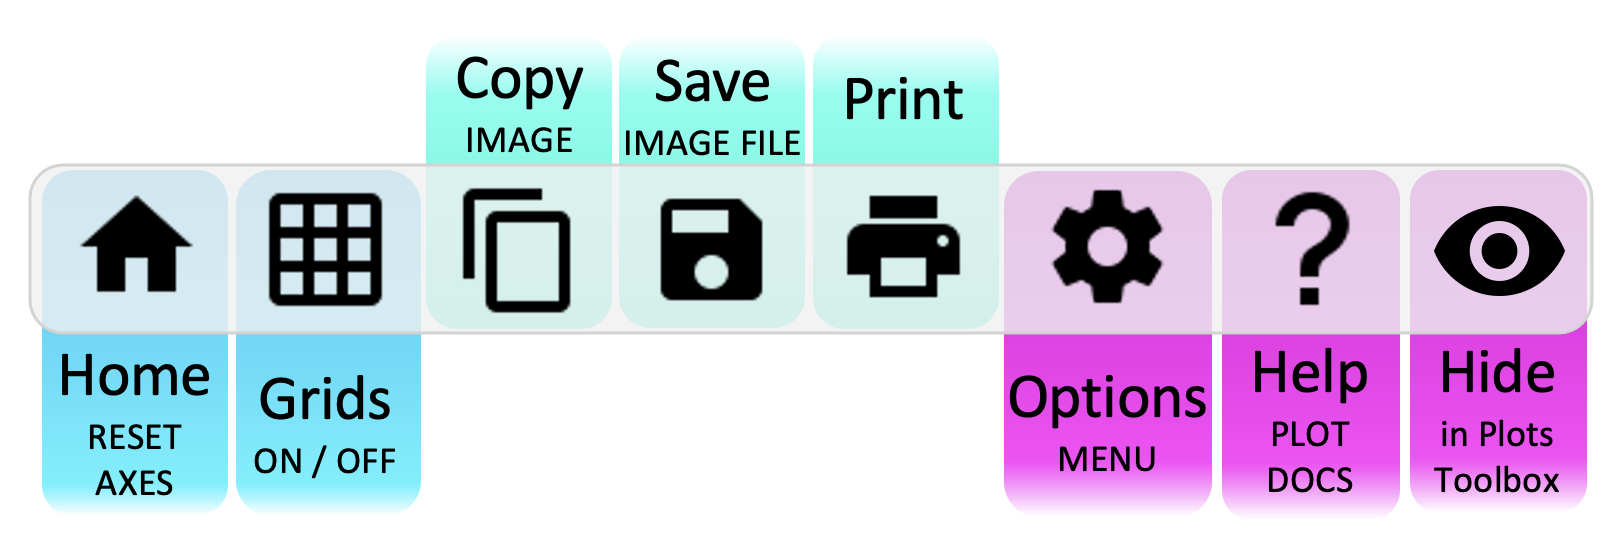
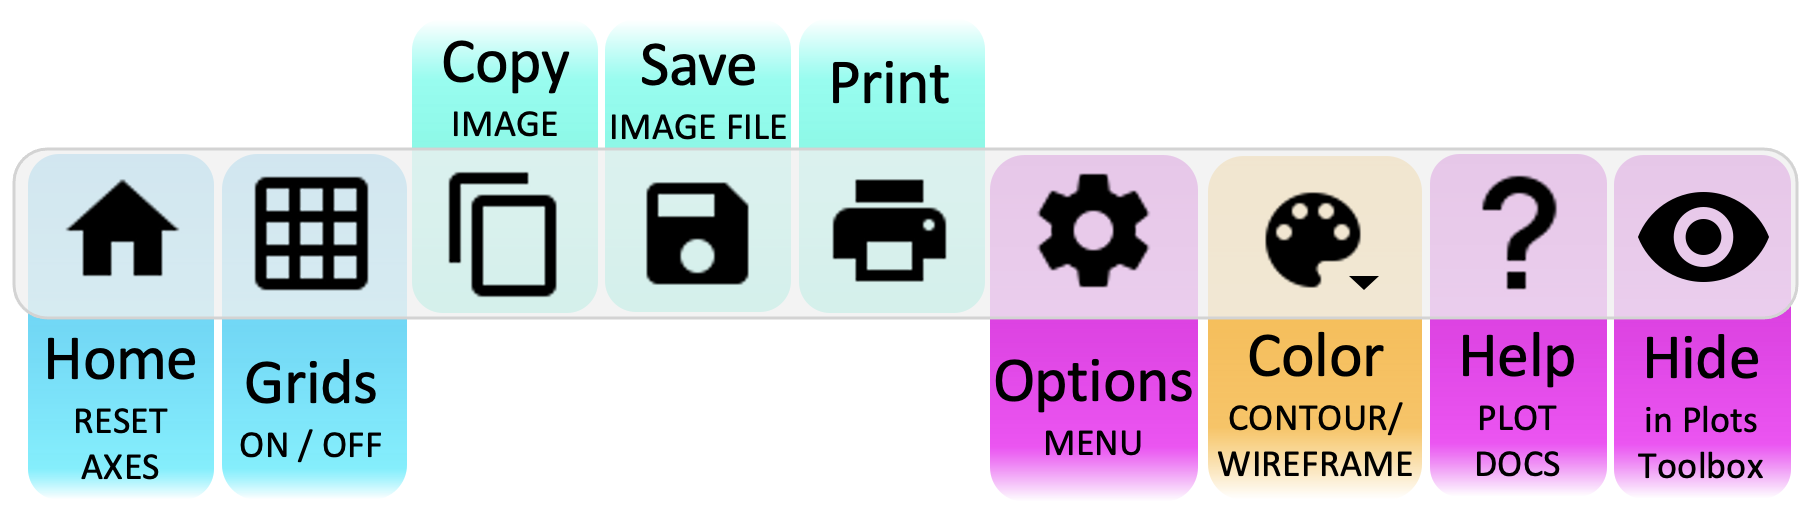
Plot Toolbar#
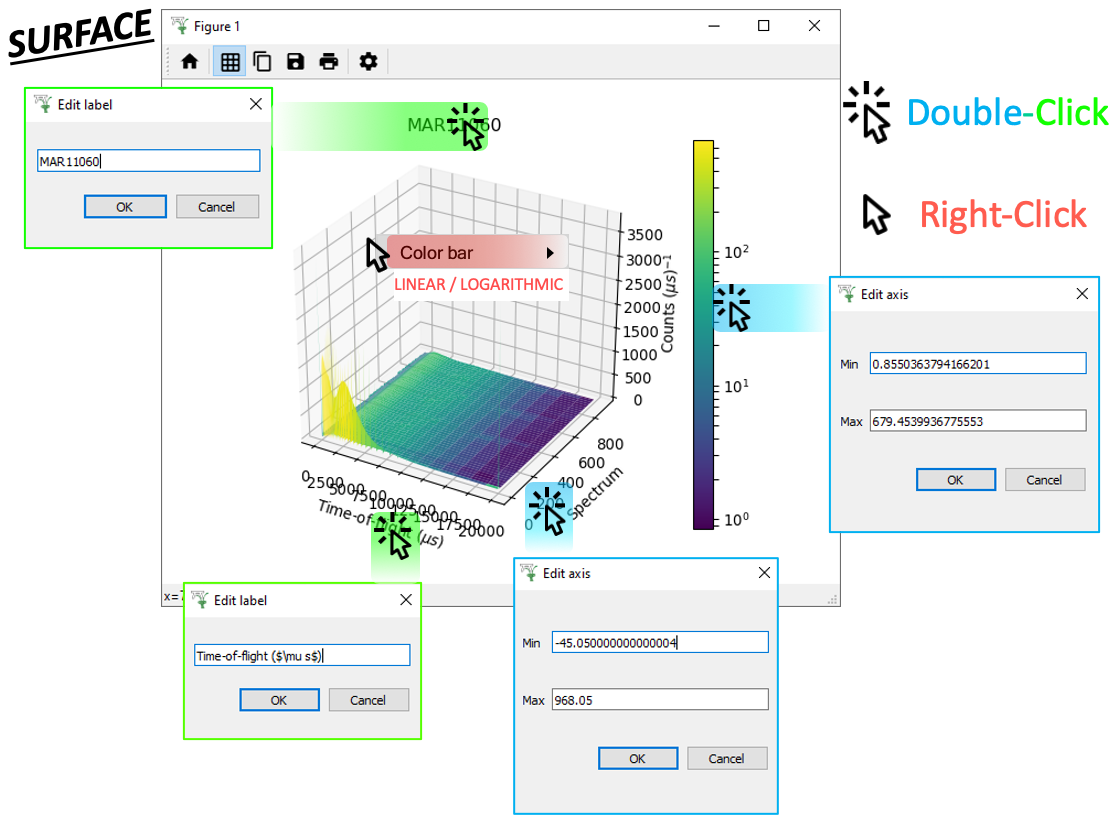
Click Menus#
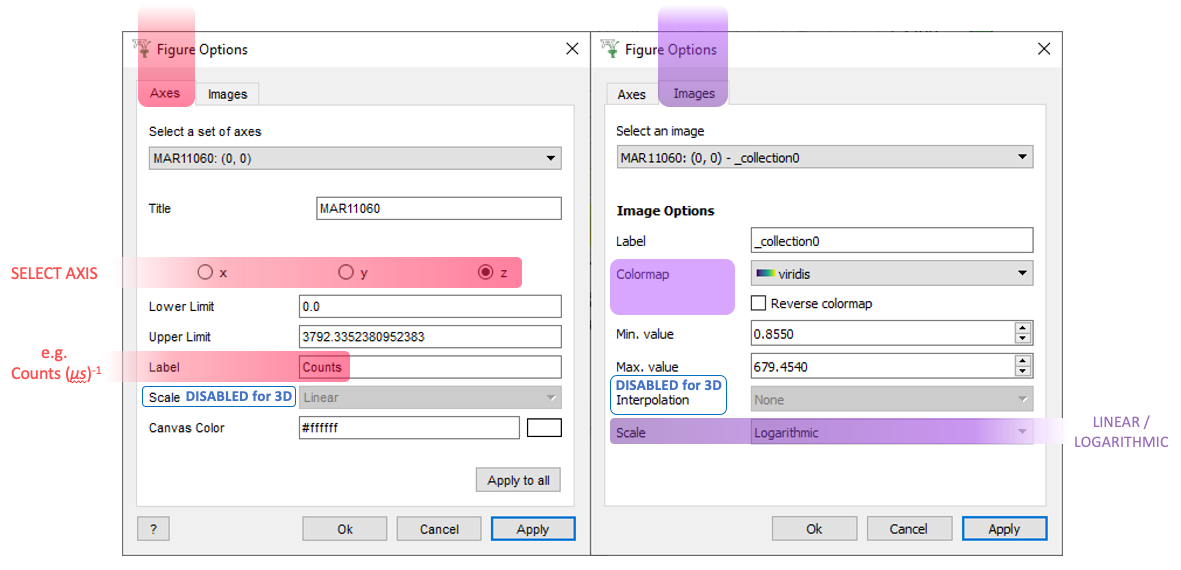
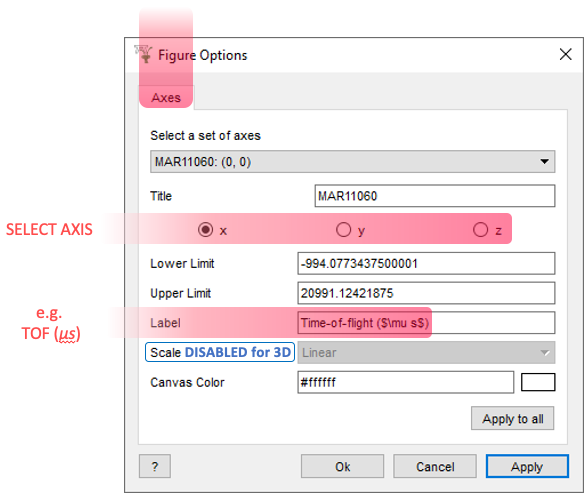
 ptions Menu#
Scripting#
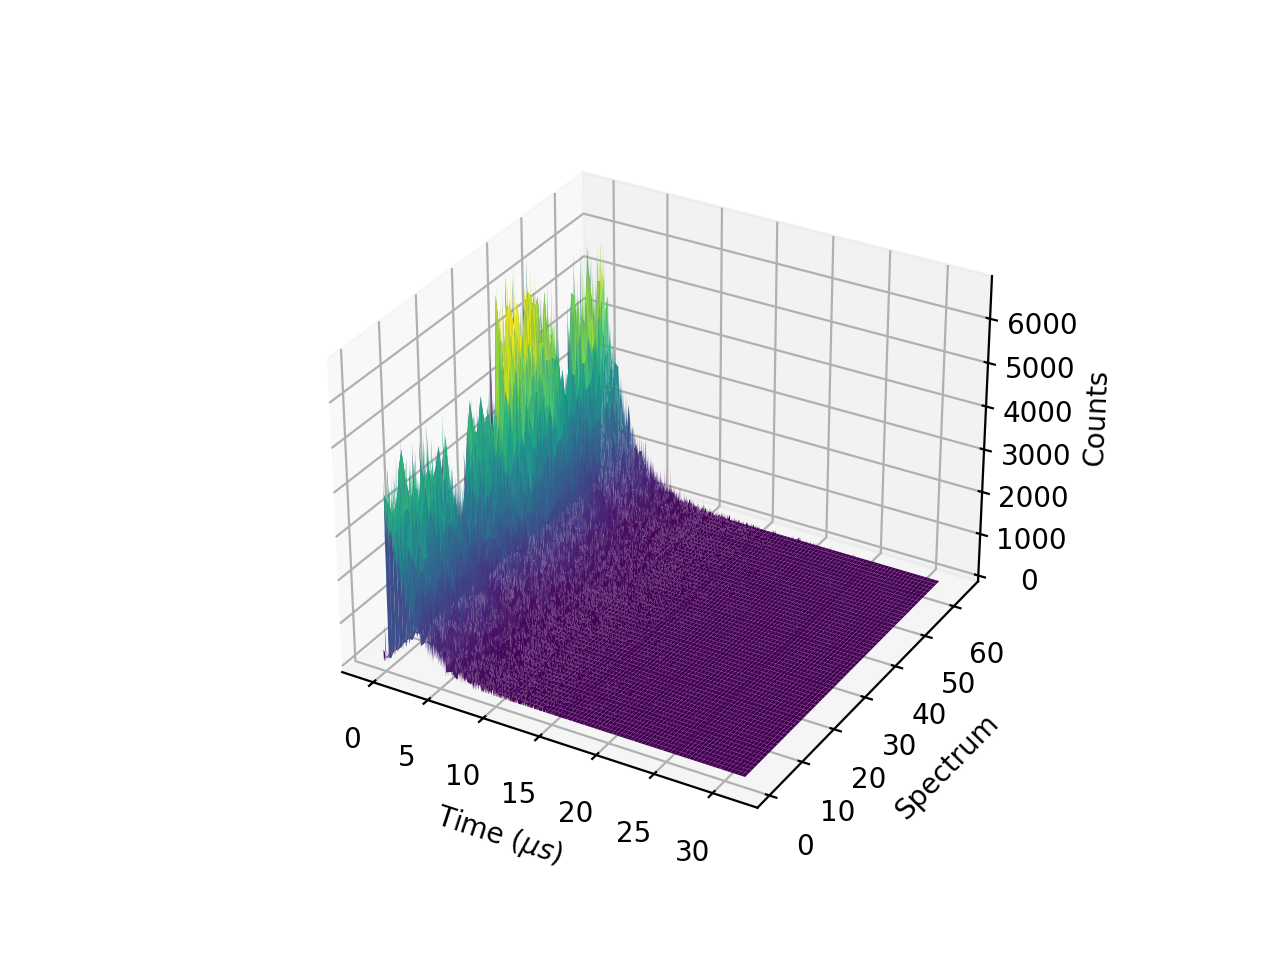
Basic example of plotting a Surface:
from mantid.simpleapi import *
import matplotlib.pyplot as plt

data = Load('MUSR00015189.nxs')
data = mtd['data_1'] # Extract individual workspace from group

fig, ax = plt.subplots(subplot_kw={'projection':'mantid3d'})
ax.plot_surface(data, cmap='viridis')

fig.show()
(Source code, png, hires.png, pdf)
For more advice: Formatting Plots with a script
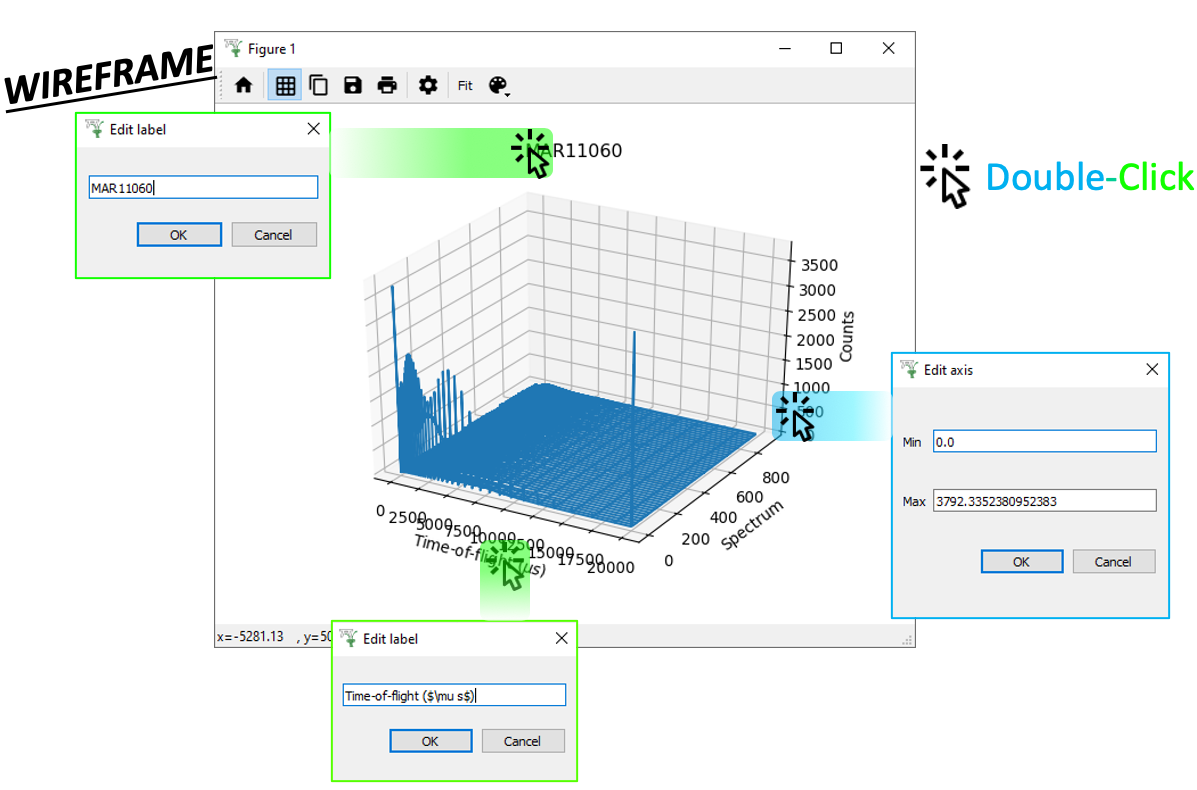
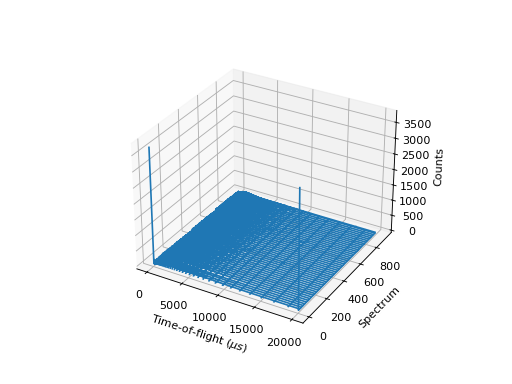
Wireframe Plots#
Plot Toolbar#
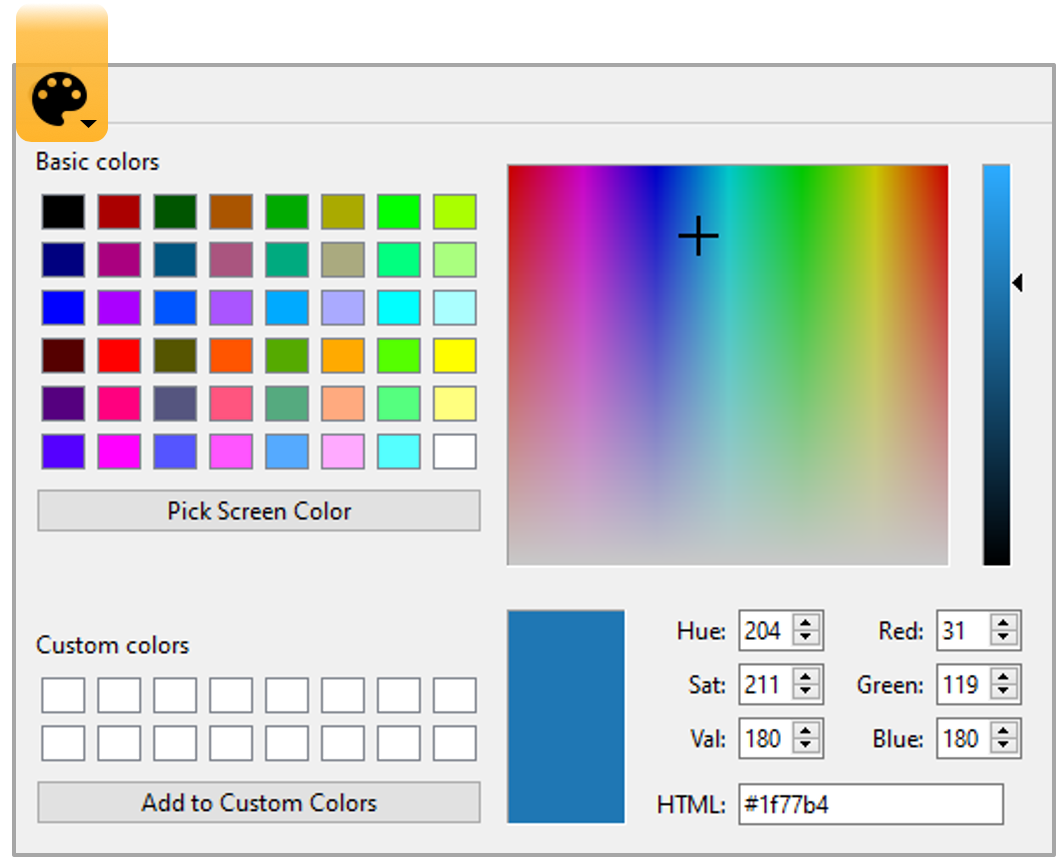
Change the Color of the Wireframe:
Click Menus#
ptions Menu#
Scripting#
Basic example of plotting a Wireframe:
from mantid.simpleapi import *
import matplotlib.pyplot as plt

data = Load('MAR11060.nxs')

fig, ax = plt.subplots(subplot_kw={'projection':'mantid3d'})
ax.plot_wireframe(data, color='#1f77b4')

fig.show()
(Source code, png, hires.png, pdf)

For more advice: Formatting Plots with a script
General#
General Plot Help
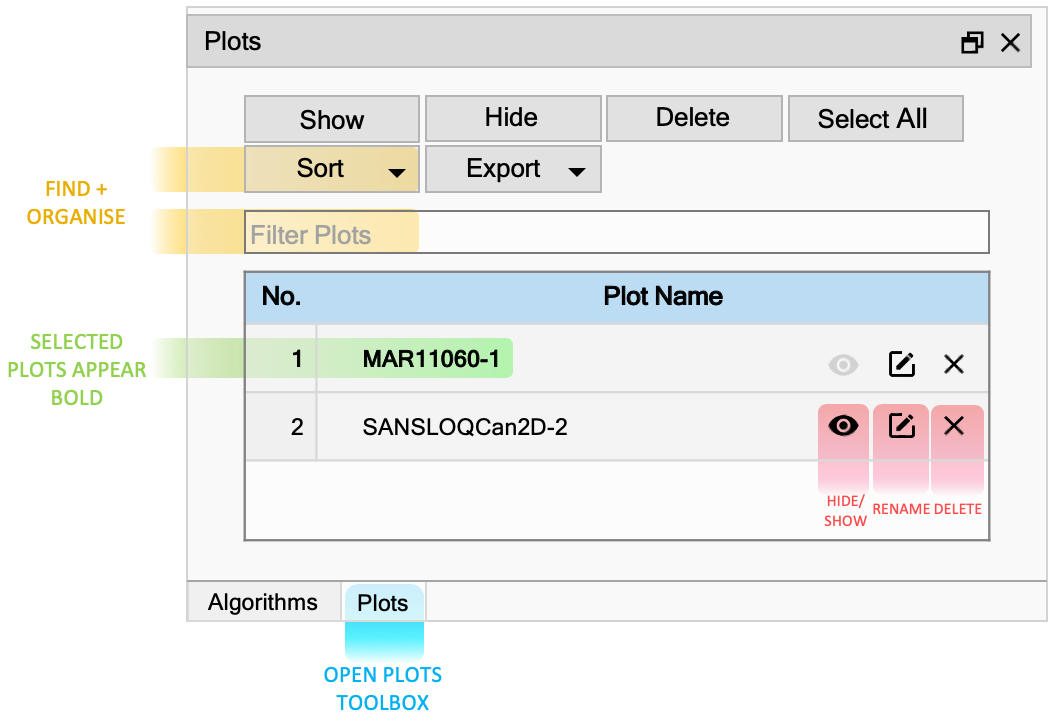
Plots Toolbox#
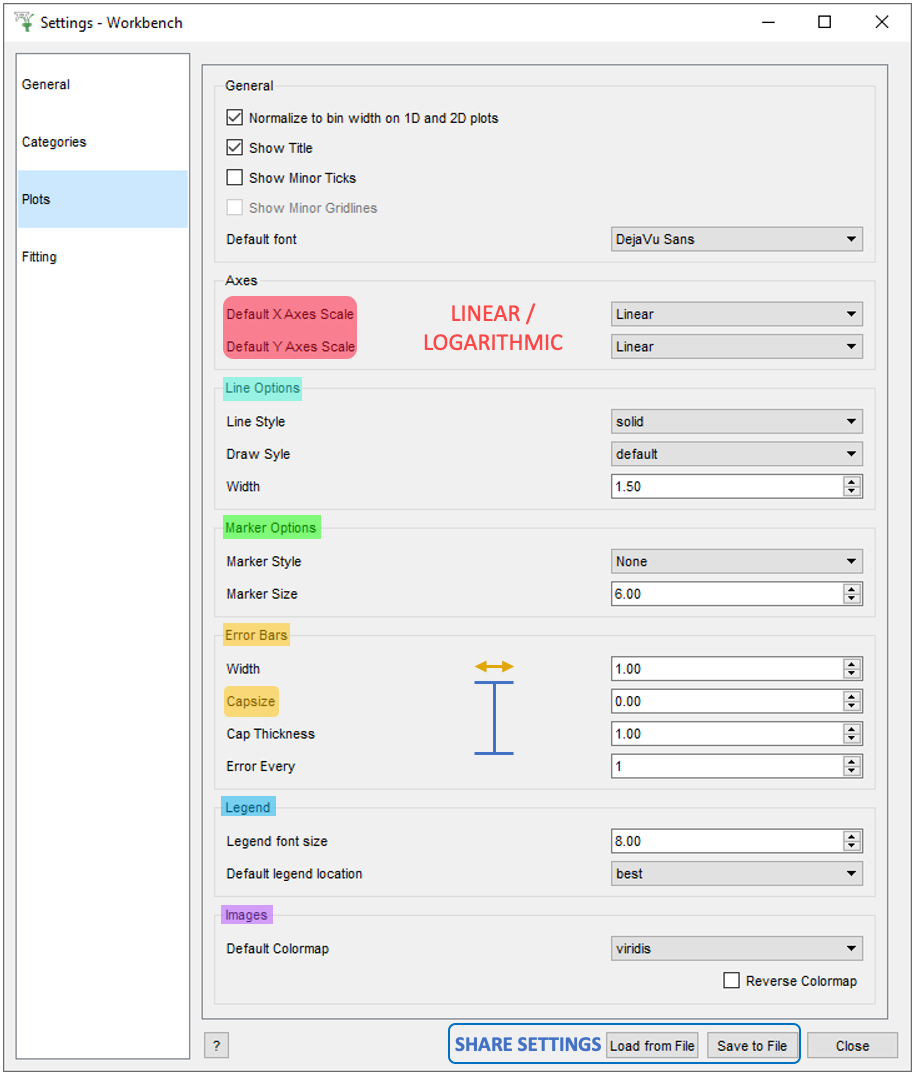
File > Settings#
Other Plotting Documentation
See here for custom color cycles and colormaps