Data Fitting#
Fit Function#
There are multiple options within Mantid for fitting data. One such solution is the Fit Function tool. The Fit Function browser is similar to the Data Analysis section of the Muon Analysis GUI, however, it is not restricted to muon analysis, and thus contains many more built-in options.
To demonstrate the process of fitting a function to a workspace with the Fit Function browser, follow the instructions below.
Open the file HIFI00062798.nxs using the Muon analysis GUI and then close Muon Analysis, as it won’t be used for data analysis.
Plot the long pair from HIFI62798 Pairs (plotting spectrums described in displaying 1D data).
Click on the data plot window and click the`Fit` button next to the gear icon. See Figure 36.
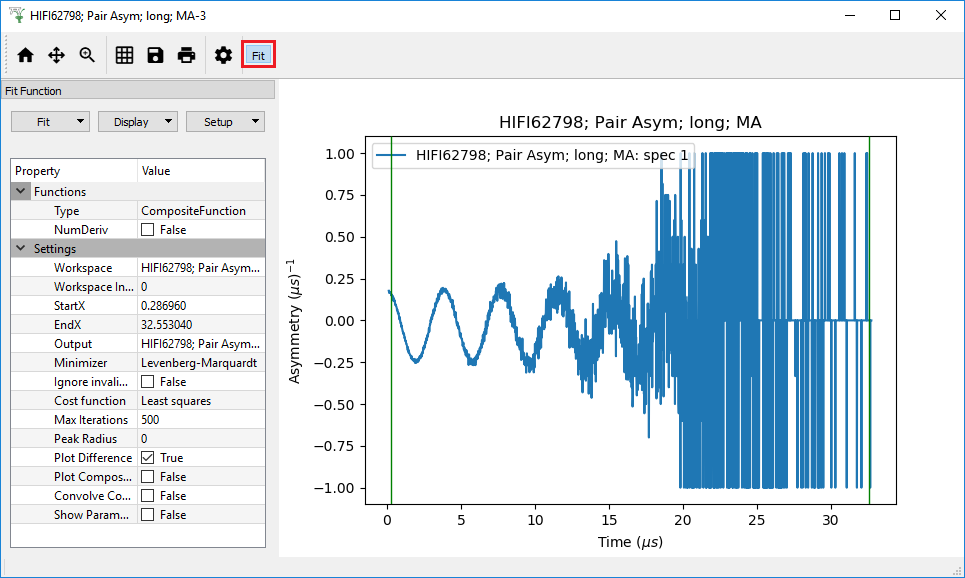
Figure 36: The Fit button and the interface.#
A new panel should now open on the left hand side of the window, this is the Fit Function browser.
Note the dashed vertical limit selection lines present on the plot. Clicking and dragging these lines the will update the data range that is used in the fit. Try this now to set the fit limits to ~`0` and ~`12` \({\mu s}\). The lines are not currently present in the Fitting tab of the Muon Analysis interface. Alternatively you can use the StartX and EndX boxes.
Similar to the Muon Analysis GUI, a function can be added by right clicking the Functions toggle and selecting Add Function. Then it is possible to pick a function from the menu. Do this now and add an ExpDecayOsc function to the data.
Alternatively, right clicking the plot, with the Fit Function browser open and select Add other function... This will bring up a selection box which lists all available fitting functions in alphabetical order.
Fit ExpDecayOsc to the data by selecting Fit in the Fit Function browser’s drop down menu. Figure 37 shows the process. Again note that a better fit is achieved if Alpha has been guessed via the Grouping tab.
Figure 37: How to fit data to a single workspace, using the Fit Function browser.#
User Defined Functions#
User Defined functions can be added using the Fit Function browser, see below for instructions on how to do this.
Load the file EMU00011888.nxs using the Muon Analysis GUI
Click on the arrow next to the EMU11888 workspace in the ADS and plot the workspace ending in fwd; Counts as described in Loading Data.
Click the Fit button at the right hand side of the toolbar to open the fit function browser.
Add the UserFunction function, this can be found in the General section of the fit function selection menu.
In the Functions panel, there will now be an undefined UserFunction. Expand it to see the parameters and click on the empty box next to the Formula input box, and then the … button which appears. This will take you to the User Function dialogue box.
In the large blank white box at the bottom of the window, define the following function; a*exp(-x/b)+c. This is an exponential decay function for our data.
Make sure that the ‘Parameters’ box contains all of the parameters for the function (a, b, c) and click Use to define the function.
The three parameters should now appear in the function. Change their default values from 0 to 1.
Fit the function to the data. See Figure 38 for the process.
Figure 38: How to Fit a UserDefined function, using the Fit Function browser.#