\(\renewcommand\AA{\unicode{x212B}}\)
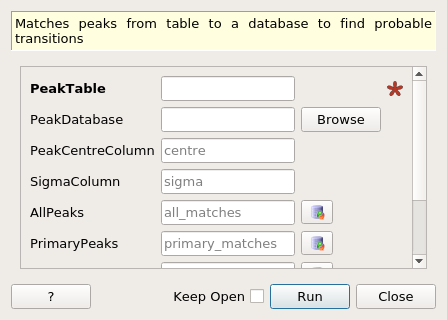
PeakMatching dialog.
Table of Contents
| Name | Direction | Type | Default | Description |
|---|---|---|---|---|
| PeakTable | Input | TableWorkspace | Mandatory | Table containing peaks to match to database |
| PeakDatabase | Input | string | json file with peak database, if none is given default database will be used. Allowed values: [‘json’] | |
| PeakCentreColumn | Input | string | centre | Name of column containing centre of peaks |
| SigmaColumn | Input | string | sigma | Name of column containing standard deviation of peaks |
| AllPeaks | Output | TableWorkspace | all_matches | Name of the table containing all of the peak matches |
| PrimaryPeaks | Output | TableWorkspace | primary_matches | Name of the table containing the primary peak matches |
| SecondaryPeaks | Output | TableWorkspace | secondary_matches | Name of the table containing the secondary peak matches |
| SortedByEnergy | Output | TableWorkspace | all_matches_sorted_by_energy | Name of the table containing all of the peak matches sorted by energy |
| ElementLikelihood | Output | TableWorkspace | element_likelihood | Name of the table containing the weighted count of elements in all matches |
This algorithm takes a table of peak centres and standard deviations, then finds overlap with a database of known values to find probable energy transitions for peaks.
{
  "Ag": {
    "Z": 47,
    "A": 107.87,
    "Primary": {
      "K(4->1)": 3177.7,
      "L(4->2)": 900.7,
      "M(4->3)": 304.7,
      "6->5": 141
    },
    "Secondary": {
      "K(2->1)": 3140.6,
      "L(8->2)": 1347.8,
      "M(10->3)": 567,
      "8->6": 122.2
    },
    "Gammas": {
      "72Ge(n,n')72Ge": 691,
      "73Ge(n,g)74Ge": null,
      "74Ge(n,n')74Ge": 595.7
    }
  }
}
Example: Using all defaults*
from mantid.simpleapi import *
import matplotlib.pyplot as plt
import numpy

def formatdict(row):
    row = dict([(column, "{:.2f}".format(value)) if type(value) == float else (column, value)  for column , value in row.items()])
    return row

table = CreateEmptyTableWorkspace(OutputWorkspace="input")
rows = [(900, 0.8), (306, 0.8), (567, 0.8), (3, 0.8)]

table.addColumn("double","centre")
table.addColumn("double","sigma")

for row in rows:
    table.addRow(row)

PeakMatching(table)

primary_matches = mtd['primary_matches']
secondary_matches = mtd['secondary_matches']
all_matches = mtd['all_matches']
sorted_by_energy = mtd['all_matches_sorted_by_energy']
element_likelihood = mtd[ 'element_likelihood']

print("--"*25)
print(formatdict(primary_matches.row(0)))
print("--"*25)
print(formatdict(secondary_matches.row(0)))
print("--"*25)
print(formatdict(all_matches.row(0)))
print("--"*25)
print(formatdict(sorted_by_energy.row(0)))
print("--"*25)
print(formatdict(element_likelihood.row(0)))
Output:
--------------------------------------------------
{'Peak centre': '3.00', 'Database Energy': '3.40', 'Element': 'Li', 'Transition': 'L(3d->2p)', 'Error': '0.80', 'Difference': '0.40'}
--------------------------------------------------
{'Peak centre': '567.00', 'Database Energy': '567.00', 'Element': 'Ag', 'Transition': 'M(7f->3d)', 'Error': '0.00', 'Difference': '0.00'}
--------------------------------------------------
{'Peak centre': '567.00', 'Database Energy': '567.00', 'Element': 'Ag', 'Transition': 'M(7f->3d)', 'Error': '0.00', 'Difference': '0.00'}
--------------------------------------------------
{'Peak centre': '3.00', 'Database Energy': '3.40', 'Element': 'Li', 'Transition': 'L(3d->2p)', 'Error': '0.80', 'Difference': '0.40'}
--------------------------------------------------
{'Element': 'Ag', 'Likelihood(arbitrary units)': 10}
Example: Renaming tables*
from mantid.simpleapi import *
import matplotlib.pyplot as plt
import numpy

def formatdict(row):
    row = dict([(column, "{:.2f}".format(value)) if type(value) == float else (column, value)  for column , value in row.items()])
    return row

table = CreateEmptyTableWorkspace(OutputWorkspace="input")
rows = [(900, 0.8), (306, 0.8), (567, 0.8), (3, 0.8)]

table.addColumn("double","centre")
table.addColumn("double","sigma")

for row in rows:
    table.addRow(row)

PeakMatching(table,PrimaryPeaks="primary",SecondaryPeaks="secondary",AllPeaks="all",SortedByEnergy="sort",ElementLikelihood="count")

primary_matches = mtd['primary']
secondary_matches = mtd['secondary']
all_matches = mtd['all']
sorted_by_energy = mtd['sort']
element_likelihood = mtd[ 'count']

print("--"*25)
print(formatdict(primary_matches.row(1)))
print("--"*25)
print(formatdict(secondary_matches.row(1)))
print("--"*25)
print(formatdict(all_matches.row(1)))
print("--"*25)
print(formatdict(sorted_by_energy.row(1)))
print("--"*25)
print(formatdict(element_likelihood.row(1)))
Output:
--------------------------------------------------
{'Peak centre': '900.00', 'Database Energy': '900.70', 'Element': 'Ag', 'Transition': 'L(3d3/2->2p3/2)', 'Error': '0.80', 'Difference': '0.70'}
--------------------------------------------------
{'Peak centre': '567.00', 'Database Energy': '567.00', 'Element': 'In', 'Transition': 'M(6f->3d)', 'Error': '0.00', 'Difference': '0.00'}
--------------------------------------------------
{'Peak centre': '567.00', 'Database Energy': '567.00', 'Element': 'In', 'Transition': 'M(6f->3d)', 'Error': '0.00', 'Difference': '0.00'}
--------------------------------------------------
{'Peak centre': '306.00', 'Database Energy': '304.10', 'Element': 'W', 'Transition': 'O(7i->5g)', 'Error': '2.40', 'Difference': '1.90'}
--------------------------------------------------
{'Element': 'Tm', 'Likelihood(arbitrary units)': 6}
Example: Using non default column names*
from mantid.simpleapi import *
import matplotlib.pyplot as plt
import numpy

def formatdict(row):
    row = dict([(column, "{:.2f}".format(value)) if type(value) == float else (column, value)  for column , value in row.items()])
    return row

table = CreateEmptyTableWorkspace(OutputWorkspace="input")
rows = [(900, 0.8), (306, 0.8), (567, 0.8), (3, 0.8)]

table.addColumn("double","center")
table.addColumn("double","standard deviation")

for row in rows:
    table.addRow(row)

PeakMatching(table, PeakCentreColumn = "center",SigmaColumn = "standard deviation")

primary_matches = mtd['primary_matches']
secondary_matches = mtd['secondary_matches']
all_matches = mtd['all_matches']
sorted_by_energy = mtd['all_matches_sorted_by_energy']
element_likelihood = mtd[ 'element_likelihood']

print("--"*25)
print(formatdict(primary_matches.row(2)))
print("--"*25)
print(formatdict(secondary_matches.row(2)))
print("--"*25)
print(formatdict(all_matches.row(2)))
print("--"*25)
print(formatdict(sorted_by_energy.row(2)))
print("--"*25)
print(formatdict(element_likelihood.row(2)))
Output:
--------------------------------------------------
{'Peak centre': '900.00', 'Database Energy': '899.20', 'Element': 'Au', 'Transition': 'M(4f5/2->3d3/2)', 'Error': '0.80', 'Difference': '0.80'}
--------------------------------------------------
{'Peak centre': '567.00', 'Database Energy': '566.70', 'Element': 'I', 'Transition': 'M(5f->3d)', 'Error': '0.80', 'Difference': '0.30'}
--------------------------------------------------
{'Peak centre': '567.00', 'Database Energy': '566.70', 'Element': 'I', 'Transition': 'M(5f->3d)', 'Error': '0.80', 'Difference': '0.30'}
--------------------------------------------------
{'Peak centre': '306.00', 'Database Energy': '304.50', 'Element': 'Tm', 'Transition': 'N(5g->4f)', 'Error': '1.60', 'Difference': '1.50'}
--------------------------------------------------
{'Element': 'In', 'Likelihood(arbitrary units)': 4}
Categories: AlgorithmIndex | Muon
Python: PeakMatching.py