Mantid Workbench Changes#
New & Improved Features#
Plotting#
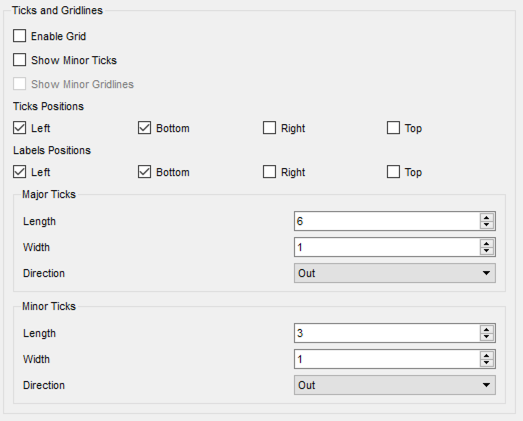
- New preferences can be set in
File > Settings > Plots: Tick customisation
Enabling grids by default
Colorbar scale preference to linear or logarithmic
Show (Hide) legend checkbox
- New preferences can be set in
In
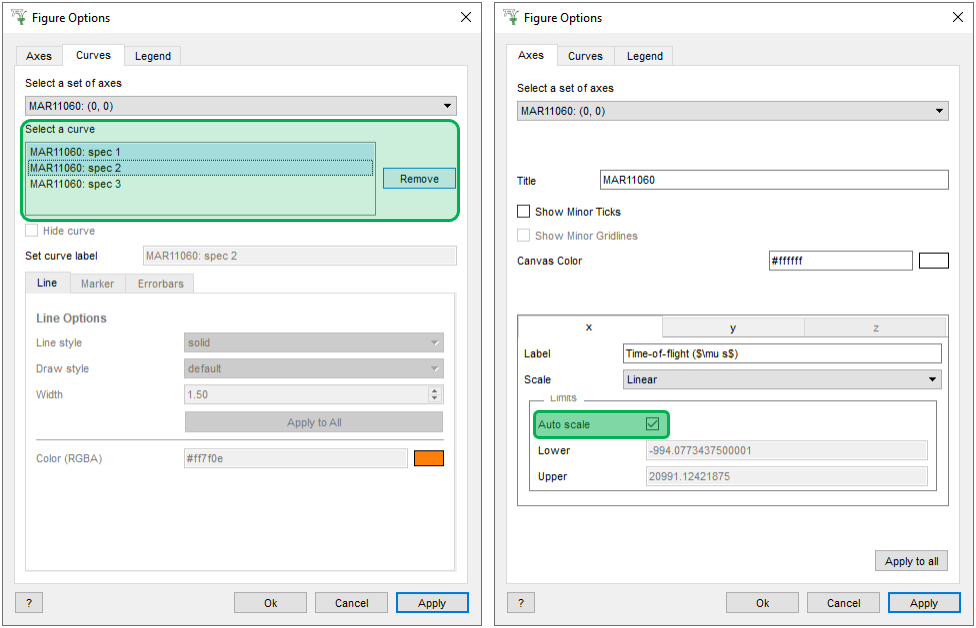
Figure options > Curves tabmultiple curves can be selected and removed at once. The delete key was added as a shortcutAdd an autoscale checkbox to figure options
Improved plot generated scripts to better support major and minor tick settings at time of generation
Enabled the plotting of individual functions in the fit browser. Plotting of each function can be performed by right clicking on the fit function within the browser and selecting plot
1D Plots from MantidPlot project files can be loaded in Workbench
Plots containing
axvlineandaxhlinecan be successfully reproduced by project saveVertical and horizontal markers on a plot no longer appear in front of the legend
Allow plotting a 1D spectrum (plot, overplot, plot_with_error, overplot_with_error) from an IMDHistoWorkspace with only 1 non-integrated dimension (but do not enable SliceViewer)
Wireframe plots no longer spill over the axes when their limits are reduced
Colorbar limits on colorfill plots allow greater precision and scientific notation
The zoom selection box has greater contrast with the image for SliceViewer and colorfill plots
SliceViewer#
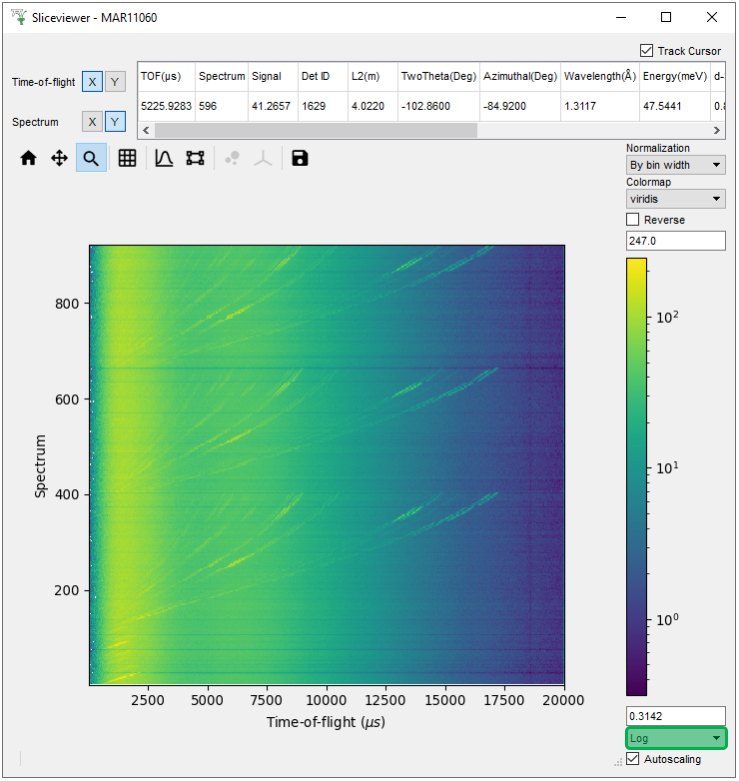
The colorbar scale can now be set to
Logwhich differs from the existingSymlogoption as it prohibits negative valuesReplots when the underlying workspace is modified .
Improved spectra selection, which should ensure that high counting spectra are shown immediately when opened.
Dynamic binning has been enabled for MDHistoWorkspaces with an attached original in the SliceViewer. Manual rebinning options are now also shown.
Sample Logs#
SampleLogs in multiperiod event workspaces are now filtered by current period
Added QLineEdit to SampleLogs widget to allow filtering its entries
Interfaces#
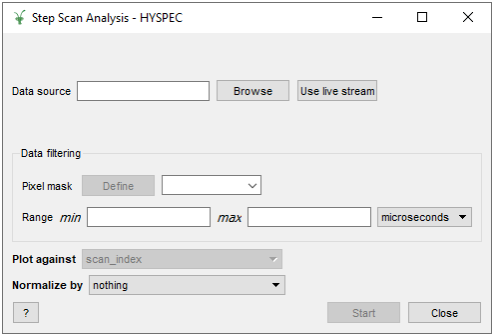
Migrate Step Scan interface to Workbench
Expose Instrument View control to Python
Add the possibility to copy and paste shapes in the InstrumentViewer using
Ctrl + CandCtrl + VIn the InstrumentViewer, the integration scroll bar can be moved, widened and shrunk using the arrow keys
Add a Python function to replace the workspace being shown by InstrumentViewer
A system to group samples and avoid repetition in DrILL has been added. See the DrILL documentation for more information.
In the plot config, multiple curves can be selected and removed at once. The delete key was added as a shortcut.
Support for D16 sample scan mode in DrILL.
Automatic data export in DrILL. See the DrILL documentation for more information.
A bug has been fixed in SliceViewer where attempting to plot a workspace with a text axis would cause a crash when zoomed out.
Improved plot generated scripts to better support major and minor tick settings at time of generation.
Allowed the use of greater precision and scientific notation when changing the colorbar limits on a colorfill plot from the Figure Options.
Miscellaneous#
Added a Dx data tab on the
Show Datatable when a workspace has Dx dataImproved the clarity of error messages generated by algorithms when access to a file is denied due to insufficient user permissions
Remove Load and Fit algorithm dialogs from autocompletion
Bugfixes#
SliceViewer#
Displayed data updates correctly when changing axis selection
The axis limits for non-orthogonal data are now calculated to display all data for that zoom level
Axes limits of sliceviewer are now updated correctly when orthogonal axes were transposed.
Now monitor spectra and spectra with nan or inf values are ignored in determining axes limits
Opening SliceViewer for a workspace with a text axis is now handled correctly.
Cursor data now work for Direct or Indirect data
It is now not possible to zoom in too far on MDE workspaces
Only enable SliceViewer for MDEventWorkspaces with 2 or more dimensions
Ellipsoid axes of integrated peaks are correctly transformed when axes swapped
A number of issues with displaying ellipsoid peak shapes have been fixed
For the elliptical shell of integrated peaks, the inner background radius is now correct
The background shell of spherical peaks is now plotted if inner radius equals the peak radius
The sort order of peaks in the peaks overlay has been corrected
Now the correct view is displayed for orthogonal axis indices in non-orthogonal view
Displayed peaks update if the underlying PeaksWorkspace has been changed, removed or cleared
Miscellaneous#
For ragged workspaces, the data table can be shown, they can be plotted, and colorfill plots have the correct horizontal extent
Script generation for bin plots now matches the output bin plot from a data table
Show spectrum numbers instead of workspace index in plotBin
A bin plot for a workspace with a numerical spectrum axis, the x axis values are from the numerical axis rather than the spectrum numbers
A colorfill plot rescales after the underlying workspace is replaced
Editing legends in-situ is now also possible on Linux platforms
Removing the last curve on a plot is now handled smoothly
In figure options the axes title is synced between the axis and curves tabs
Error handling for using broken e notation for plot axis limits
The error every value in figure options now matches the plotted error bars
Deleting rows or columns in a TableWorkspace is handled smoothly
The fit button in the fit browser is now disabled when all functions are removed
Pressing
Escto close ManageUserDirectories is now handled correctlyFixed a crash when selecting Show Detectors on a workspace with a spectrum which is missing an EFixed and is not a monitor.