Exercise 4#
Here we aim to write a small algorithm that performs a reduction and conversion to energy transfer of some raw data. This is essentially a snippet of the proper reduction done for the direct-geometry inelastic instruments.
Write an algorithm called ConvertToEnergy. The algorithm should have
4 properties:
Filename: A
FilePropertyfor a file to load (ignore extensions).Ei: A float property for the incident energy, with a validator to check that it is positive and non-zero.
BinParams: A
FloatArrayPropertythat will contain the binning of the final workspace.OutputWorkspace: An output
MatrixWorkspacePropertyto hold the final result.
The steps the algorithm should perform are:
Use the Load algorithm to load the file to a workspace, setting
LoadMonitors = "Exclude".Run the ConvertUnits algorithm on the previous workspace and put the output in the same workspace. Use
Target='DeltaE', EMode='Direct', EFixed=valueof Ei property.Run the Rebin algorithm on the previous workspace and put the output in the same workspace. Use
Params=valueof theBinParamsproperty.Create a new workspace that is the sum of all of the spectra in the output from
Rebin(Hint: Use theWorkspaceFactoryand create a workspace that uses the existing one as a template but with one row).Set the X values on the new workspace to the X values from the first row of the existing workspace.
Loop over the existing workspace and sum up the values and put them in the new workspace. Do not add together values in spectrum 1, but instead add the first value in spectra 0, 1, 2 … together, then the same for the second value, and so on.
Delete the temporary workspace using DeleteWorkspace.
Set the new workspace to the
OutputWorkspaceproperty.
To test the algorithm, execute the file that contains the algorithm to register it with Mantid. It will then show up in the list of algorithms. Use the following inputs:
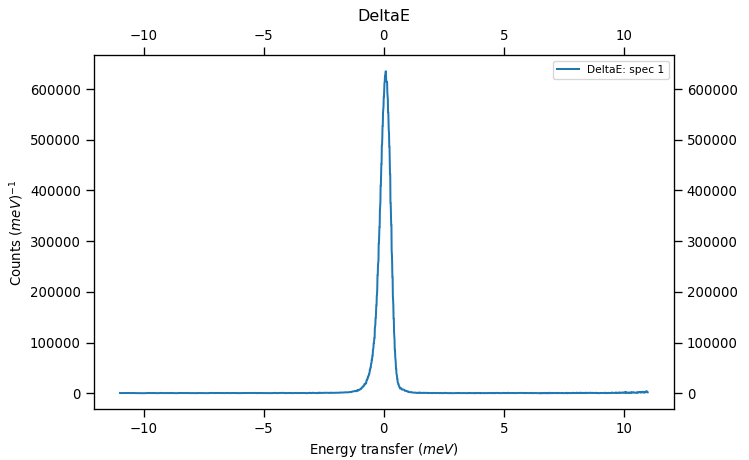
Filename: MAR11015.rawEi: 12.9729BinParams: -11,0.01,11OutputWorkspace: DeltaE
Plot the single spectrum that has been output and the peak should have its centre at 0 and look like this:
Once finished check your answer with the provided Exercise 4 Solutions