Mantid Workbench Changes#
New Features#
Added button to the figure tool bar which hides the figure (unhidden using the plots tab).
Subsampling of data on surface plots is now only performed if the number of rows or columns is greater than 100 (instead of 50).
Mantid Workbench is now compatible with matplotlib v3.6.
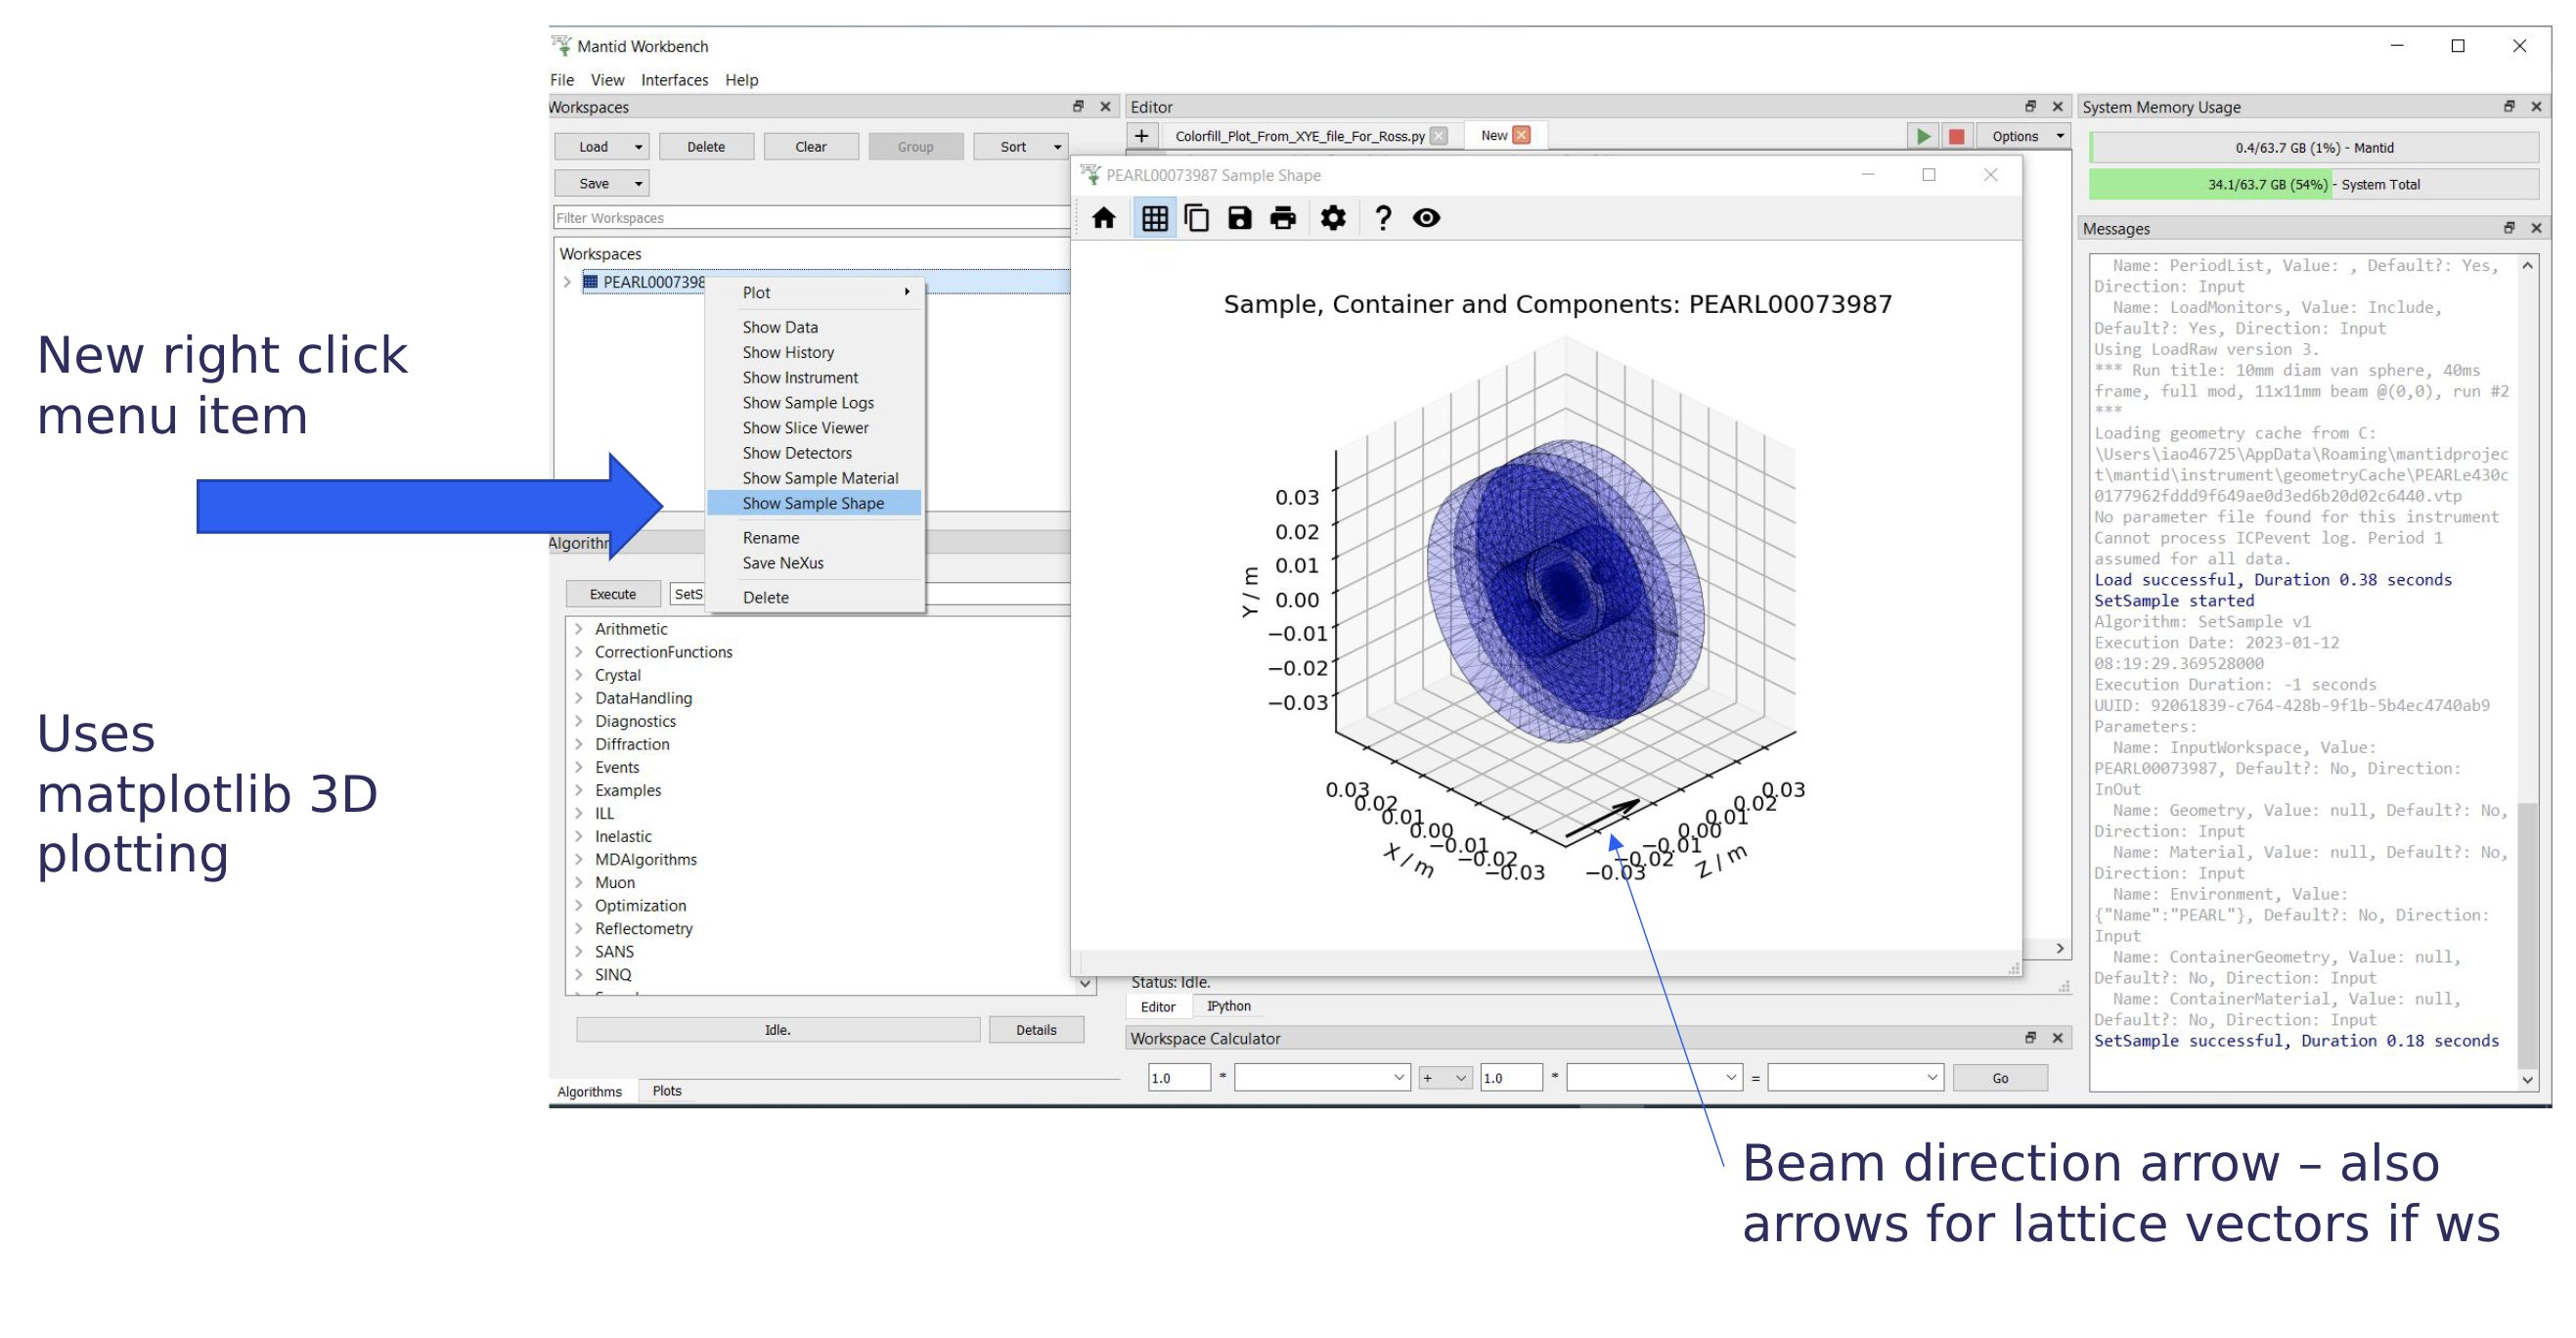
Sample shapes can now be plotted by right-clicking the workspace and selecting
Show Sample Shape. This will plot all Sample, Container and Component shapes attached to the workspace, add a black arrow for the beam direction and coloured arrows for the lattice vectors. For more details see 3D Mesh Plots for Sample Shapes.
Scripts generated by the Algorithm History Interface now include an import of
mantid.simpleapi.Qt has been upgraded to version 5.15.
Normalisation (by maximum value) is now available in Superplot.
Drop support for ICAT v3.
Mouse cursor now changes to a horizontal double arrow when hovering over peak and range markers in the Fit Browser, indicating they can be dragged left and right.
A label showing the maximum character limit of the additional context text has been added to the Error Reporter.
Bugfixes#
Fixed a bug that prevented arrays from displaying properly in sample logs.
Fixed a bug where the user couldn’t reselect a peak in the Fit Browser after adding another.
In the Fit Browser, if a tie is edited to an invalid value, Workbench will now display an error and revert the tie to its previous value.
Fixed a bug where the Superplot plot area shrunk on some data.
Fixed a bug where data from workspaces accessed from the Fit Browser (i.e the fit parameters) could not be copied.
Saving script from history dialog in Linux will now be saved with
.pyextension.When a file with mantid algorithms is loaded, and the user accepts workbench adding the mantid API import line, the new import is now always added to the top of the file.
Fixed a bug where waterfall plots were updated unconditionally during ADS updates.
The sensitivity of vertical and horizontal lines on plots, including the peak picker and range selector tools, has been increased.
Fixed bug where Load and Rebin showed up twice (upper and lower case) in the algorithms tab search.
Fixed a bug where property values were shortened in history.
Fixed a bug in the Mean algorithm where an invalid input workspace name would cause Mantid to crash.
Fixed a bug where the user could drag the width markers of an unselected peak in the Fit Browser.
Fixed inconsistent text sizes when opening multiple script editor tabs on macOS.
Fixed a bug with AddSampleLogMultiple where including log types and keeping the parser box ticked would crash Mantid.
Fixed a bug where Delta and Elastic function peaks were not connected to the Fit Browser GUI.
Fixed a bug where collapsing plots using a splitter handle could result in a crash.
Grid lines will now not turn on unexpectedly when changing axis format in a 3-D plot.
Fixed bug where plot marker labels became unattached when zooming and panning.
When plotting with an exported script, the
Show Minor Gridlinescheckbox in the Axes tab will be ticked.The
toggle grid linesbutton affecting minor lines has been fixed.Fixed links to tutorials on the About widget which were broken.
The tooltips of properties in an algorithm dialog will now provide the full description of a property.
Fixed a bug where plots with error bars could not have normalisation turned off.
InstrumentViewer#
New features#
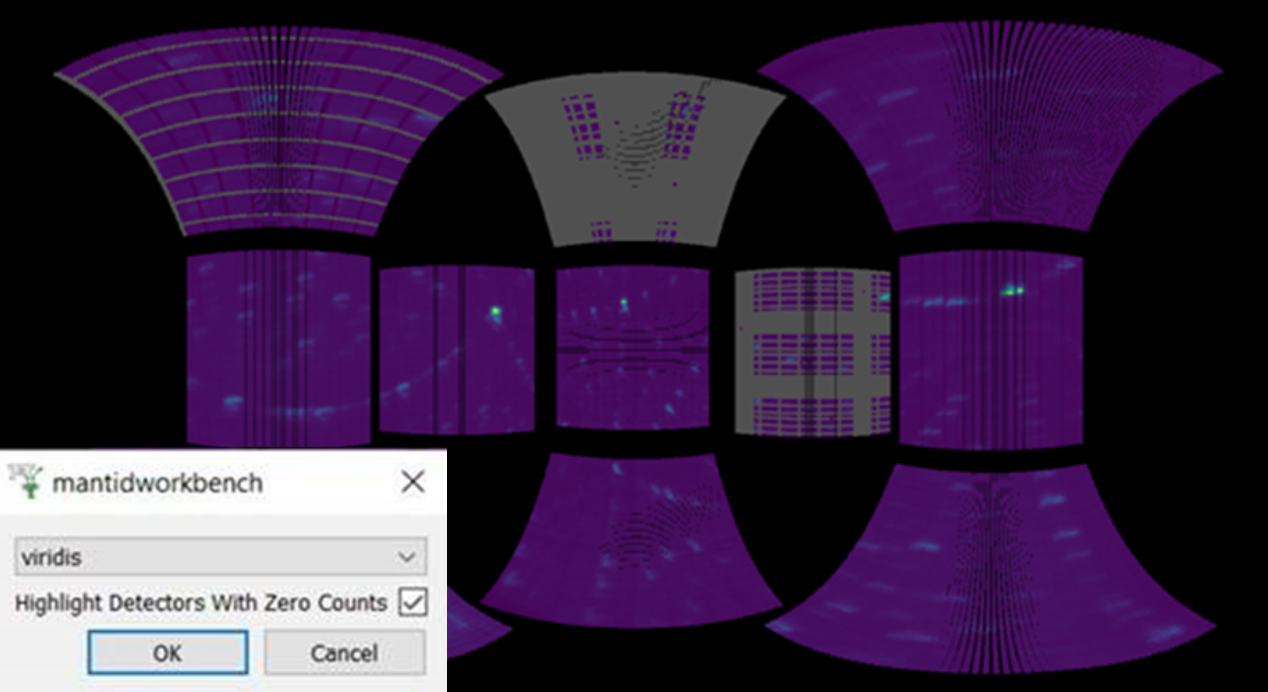
Added an option to the Instrument Viewer display settings to highlight detectors with zero counts.
Bugfixes#
The sensitivity of resizing a masked shape using its corners has been increased for screens with larger resolutions.
Fixed a bug where Y histogram data was not being summed correctly when plotting ALF data on the Pick tab in units of ‘Out of Plane angle’.
SliceViewer#
New features#
Added HKL values to the image info table in the slice viewer when viewing a workspace with HKL coordinates.
Users can now double click on the SliceViewer plot axes to edit their limits more accurately.
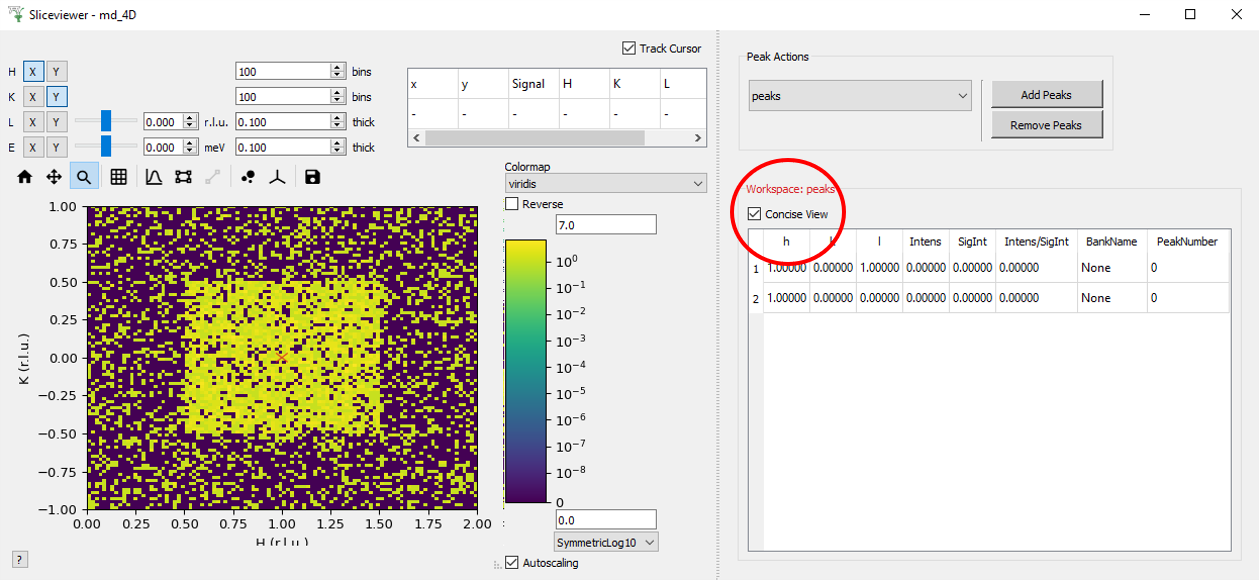
Added
Concise Viewcheck box to the SliceViewer Peak View to show a reduced number of columns in the peak table view.
Enabled the cut viewer tool in non-orthogonal view.
Bugfixes#
Fixed a bug in SliceViewer where the line plots produced by the ROI tool were not updated if the cursor was released outside the axes.
Slice viewer now displays
-instead of-DBL_MAXin some energy transfer readings.Fixed a bug causing cut representation to be re-drawn on the sliceviewer colorfill plot on changing viewing axes when non-axis aligned cutting tool was not enabled.
Fixed a bug in the SliceViewer where a matplotlib deprecation warning appears when toggling on the nonorthogonal axes.
Fixed a bug where the SliceViewer plot would resize by small amounts as the cursor info changed.