UI & Usability Changes#
Installation#
Windows#
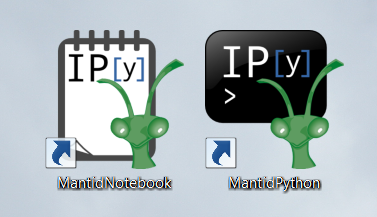
Shortcuts to launch an IPython console or IPython notebooks using Mantid’s Python environment are created in the start menu and on the desktop when MantidPlot is installed.
OS X#
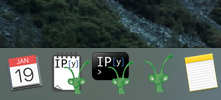
Applications to launch an IPython console or IPython notebooks using Mantid’s Python environment can optionally be installed with MantidPlot on OS X.
User Interface#
Plotting improvements#
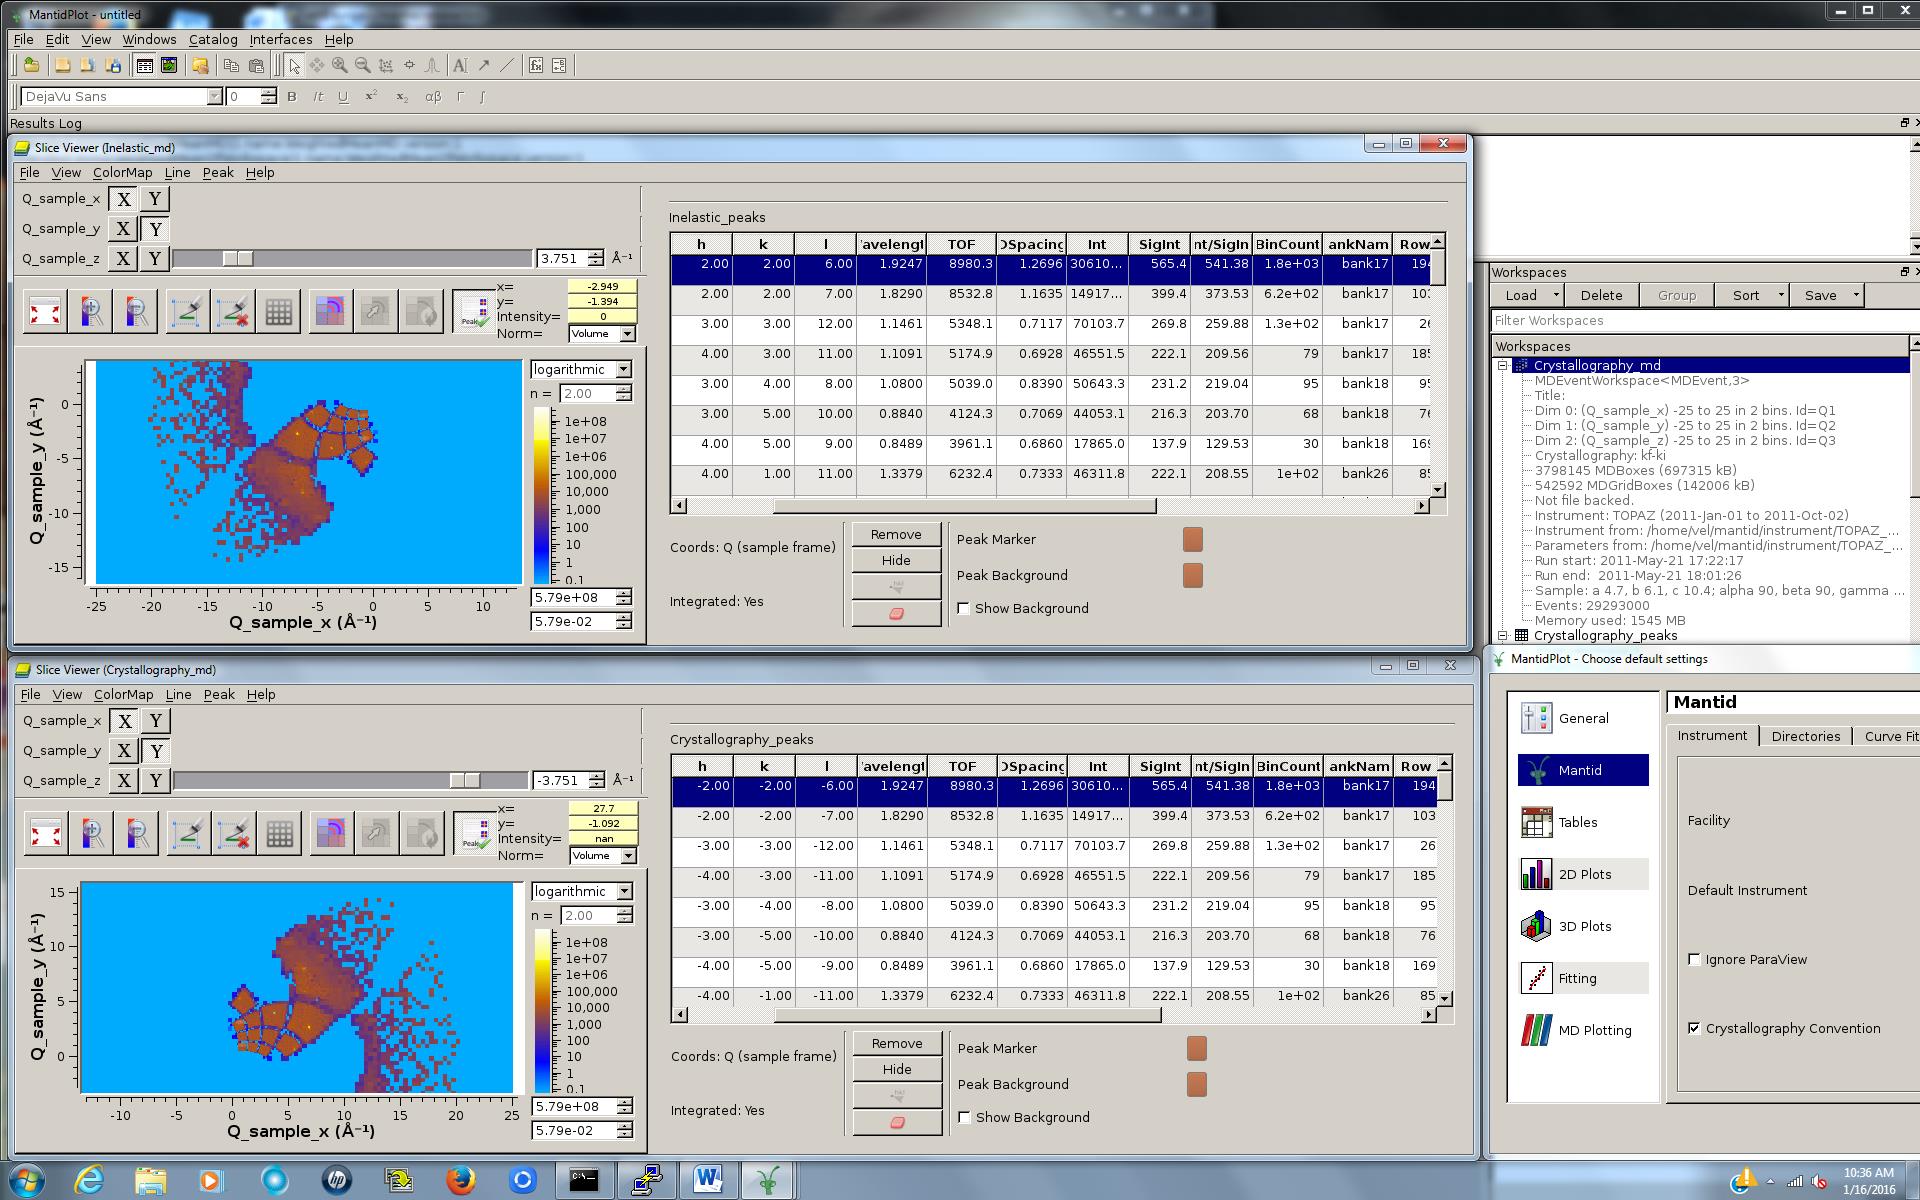
HKL and Q can be displayed in the MantidPlot table and also in the SliceViewer and VSI plots with the opposite signs if Q.convention=Crystallography is set Mantid.user.properties or Crystallography Convention is checked in Preferences. LoadMD will convert old MD files when using Crystallography convention (kf-ki) if they were saved in the default convention (ki-kf). The convention used for MDWorkspaces and PeaksWorkspaces will be displayed when the workspace is right-clicked. The new ChangeQConvention algorithm should only be used on MD workspaces that contain only Q or HKL dimensions. If there are other dimensions, user should still run this algorithm (so that the convention flag is changed), but then run TransformMD with -1 for the non-Q dimensions.
Plot MD plots now show a context menu option to change the type of normalization (volume/none/number of events).
The VSI has been updated to use ParaView v5.0.0, which includes changes to the color/opacity presets and a rewritten OpenGL v3.2 rendering engine.
The Viridis colormap is available in the VSI.
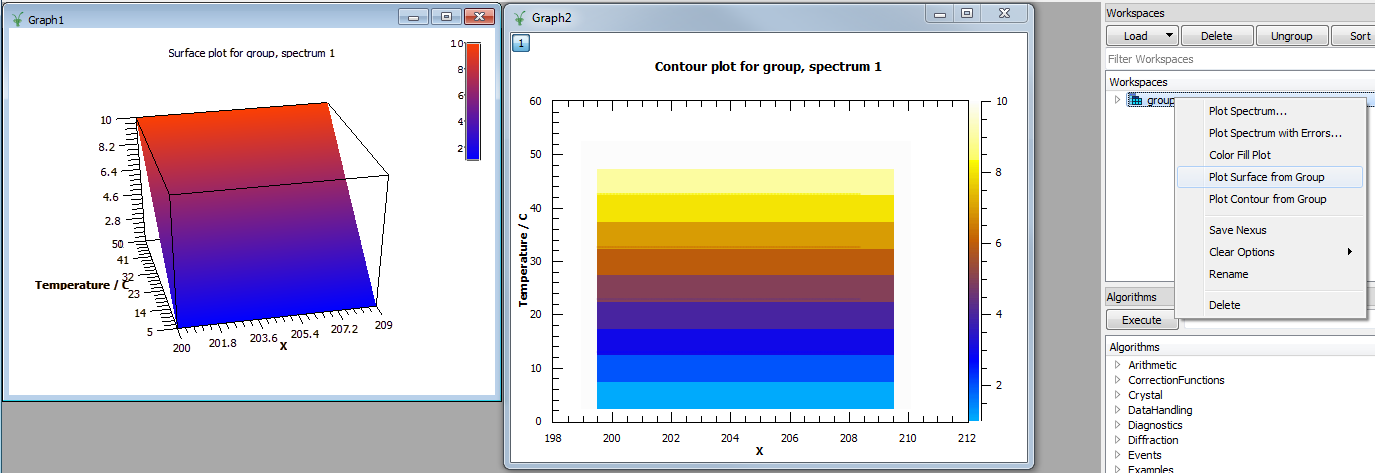
A new right-click option on WorkspaceGroups enables a 3D surface or contour plot to quickly be generated from groups. Data from each workspace in the group can be plotted against workspace index or any numeric, single-valued log value (for example temperature, magnetic field…) If the desired data has not been added to the workspaces as a log, it can be supplied manually in the dialog (or added using the AddSampleLog algorithm).
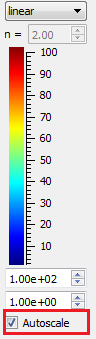
ColorFill plots and SliceViewer now use the global option set under View/Preferences/2D Plots/Autoscale to determine whether or not the color scale will be reset every time the data is updated. This enables turning the option off when these tools are being used to view live data. A checkbox has been added to the SliceViewer to control this option on a plot-by-plot basis as well.
Algorithm Toolbox#
The categories found under the Algorithm tool box have been made neater. They should now be easier to find since lists are shorter. Of course you can still use the search box and type in the first few letters of any algorithm if you have trouble finding it.
As part of this improvement we have removed the PythonAlgorithms category, which contained a large mix of algorithms for different areas. These have now been merged into the categories that describe their use.
Scripting Window#
The scripting window now allows soft line wrapping of text which can be toggled on and off.
Documentation#
The help pages for all of the workspace types, together with the instrument, sample and run objects have been improved and now contain a collection of automatically tested Python usage examples. This will be available in both the online and offline help pages.
We have improved the way category links work at the bottom of the Algorithm help pages, so they handle subcategories much better.
The documentation pages for MoveInstrumentComponent and RotateInstrumentComponent have been improved and pictures have been added to describe the effects on ComponentAssemblies (components made up of other components) such as tubes or banks.
Latex equations are once again being generated in the Qt Help on OS X.
Bugs Resolved#
When viewing an MDEventWorkspace, the Axes Grid is now visible.
When duplicating a window (Graph, Color Fill plot or table), the data is now copied into the newly duplicated window.
Fixed a bug which could cause a crash when trying to “List Data” from a large MDEventWorkspace.
SliceViewer Improvements#
Default normalization for MDWorkspaces is automatically chosen. This makes the SliceViewer consistent with the Vates Simple Interface 3D visualisation.
Automatic rescaling of the color scale when data is reloaded can be turned off using a new checkbox. The default for this option can be set in View/Preferences/2D Plots/Autoscale.
Fixed bug that caused integration radius of peaks in the SliceViewer to be plotted incorrectly.
Full list of GUI and Documentation changes on github