Mantid Workbench Changes#
New Features#
(#41234) The Script Editor of Mantid Workbench can now be toggled between the default light and a new dark theme via the General Settings on all platforms (macOS, Windows, Linux).
(#41263) Plots can now be normalised by \(Q^{-4}\) (provided the X dimension is in \(Q\)) via the right-click menu.
(#40996) The Help documentation now opens in the system’s default web browser instead of an embedded viewer, improving
Qt6compatibility. Theqtwebenginedependency has been removed. This change was necessary in order to resolve issues with the render limitations ofqttextbrowserand to ensure that the help documentation is displayed correctly across different platforms.
Bugfixes#
(#41303) The Error Bars Settings (CapSize, Cap Thickness, Width, Error Every) are now correctly applied when plotting a spectrum with errors.
(#41295) Colorfill Plots now allow over plotting with a
TableWorkspace, issuing a warning instead of raising an exception.(#41515) The StartLiveData v1 GUI no longer crashes when processing is set to
algorithmand the user is searching for an algorithm in the dropdown menu in theProcessing Steptab.(#41389) The Messages Window now prints logs that are more readable in both light and dark mode at all logging levels.
(#41083) The Superplot documentation is now correctly launched when the plot is a
Superplotand the Help button is clicked.
InstrumentViewer#
New features#
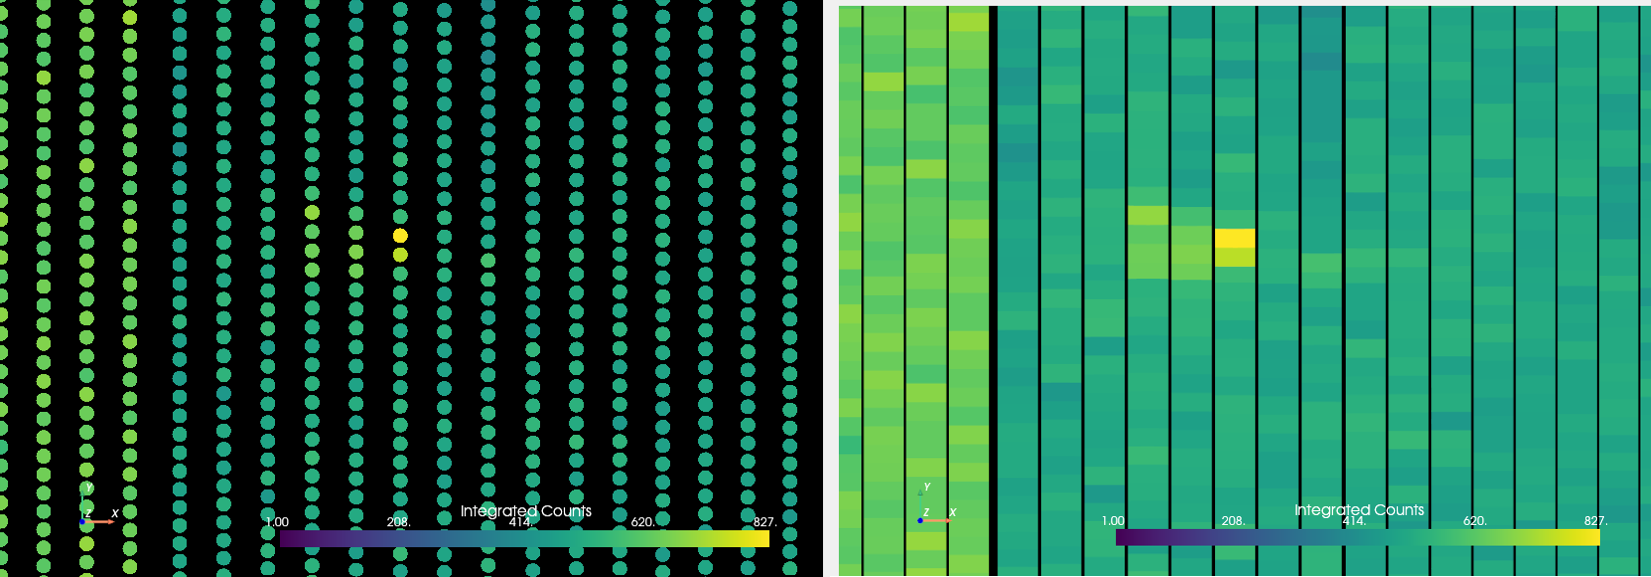
Detectors rendered as points versus as their actual shapes#
- Updates to the new Instrument Viewer:
(#41169) Peak selection no longer requires constantly clicking buttons for adding and deleting peaks. Now peak selection is triggered with a peak selection mode that lets you continually select detectors and add (left mouse click) and delete (right mouse click) peaks without extra clicking or moving the mouse around.
(#41437) The Detector Info box now shows up at the bottom and is hidden when no detectors are selected or when too many detectors (more than 3) are selected. This should reduce the visual clutter on the GUI.
(#41184) The
Draw Shapesoption is now stored in the Mantid properties file, and the option is applied when the view is opened. This means that if you checkDraw Shapes, close the view, and open it again, it will still be checked and shapes will be drawn. The option is stored under the keyInstrumentView.DrawShapes.(#40841) A new ellipse widget for selecting detectors has been added.
(#40850) An option to draw detectors using their actual geometric shapes instead of as points has been added.
(#41001) An option to display counts on a log scale is added.
(#40830) New reset buttons for the contour and integration range sliders have been added.
(#40811) Now displays the component tree from the IDF and allows you to select one or more components in that tree.
(#41221) Counts data is now updated when the integration range
min == max.(#41054) Now allows Groupings and Masks to be saved as
.calfiles.(#41348) The projection is flipped along the beam axis (from the instrument) instead of the z-axis.
(#41315) The ISIS Reflectometry Interface now supports the new Instrument Viewer as an option available in the settings.
Bugfixes#
- Issues resolved for the new Instrument Viewer:
(#40834) The mouse wheel events on the projection and units combo boxes are no longer triggered when the mouse is hovering over them. This prevents the projection and units from being changed unintentionally when scrolling with the mouse wheel.
(#41051) No longer crashes when a
LOQworkspace is open and side-by-side projection is selected.(#41221) No longer crashes when the integration range is edited through text boxes and window is closed.
(#41413) No longer crashes when masking all detectors.
(#41201) Now exits without an error message when the interface is closed while certain operations are still processing.
SliceViewer#
New features#
(#41314) The SliceViewer now supports
invertedmasking using the rectangular, elliptical and polygonal masking selectors.