Sliceviewer Changes#
New Features#
The new Sliceviewer provided in mantidworkbench has acquired several new features in this release including:
Overlay of peaks workspaces
Non-orthogonal axes view mode, including peaks workspace overlays
ROI preview and extraction
New cursor information widget that, for a MatrixWorkspace, includes quantities such as \(l1, l2, 2\theta\) etc
Arrow keys can now be used to move the cursor a pixel at a time when single-pixel line plots are enabled
Zoom mode is now selected by default
Removed reverse colormaps and added a checkbox
Colormap follows default in settings
Colorbar scale remains set when reopened
Width of line plot lines has been reduced
The intensity scale on the line plots now follows the scaling set on the colorbar
The figure options button has been removed as most options did not apply to it.
The following sections illustrate some of these key new features.
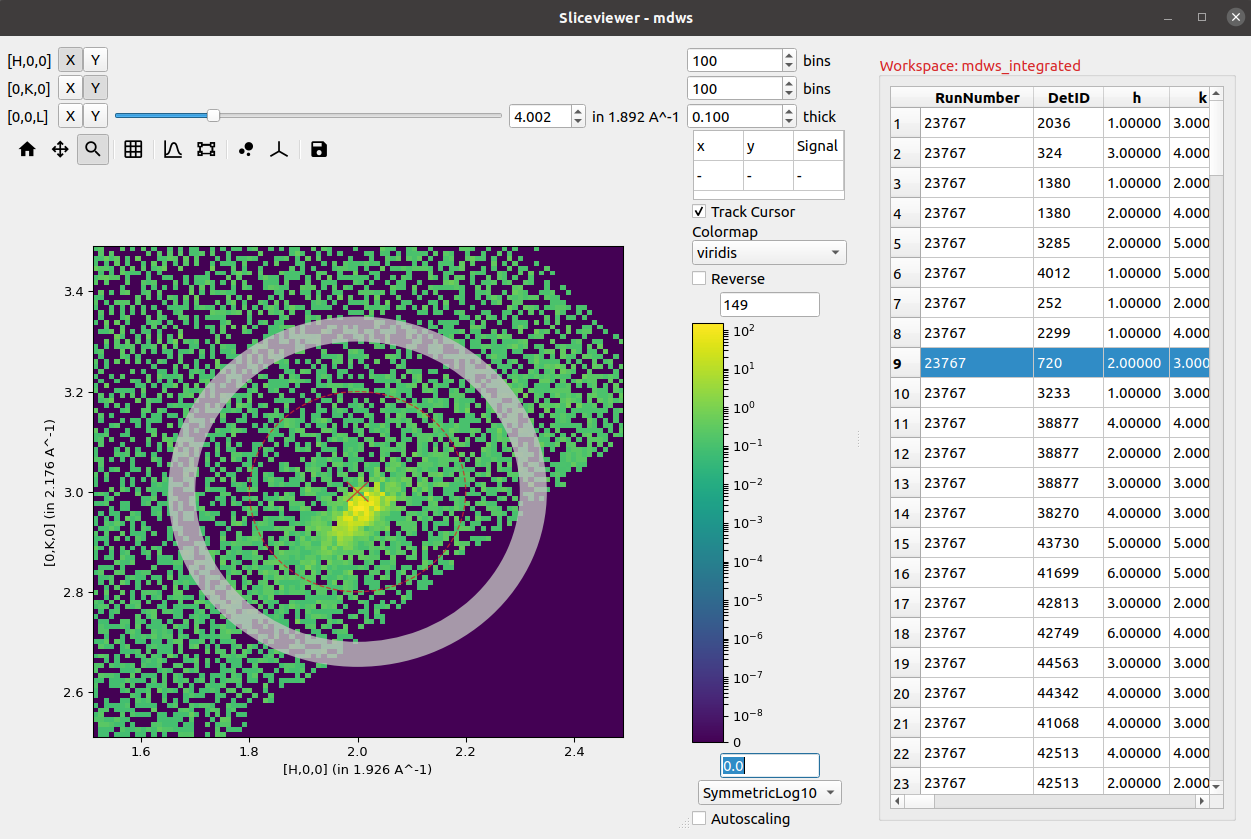
PeaksWorkspace Overlay#
The peaks overlay button allows selection of one or more PeaksWorkspaces to display on top of the main data image. This is only enabled for MD workspaces.

Peaks are displayed at the locations defined by each peak center with an ‘x’, while optionally displaying any peak shape if a given peak has been integrated.
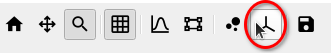
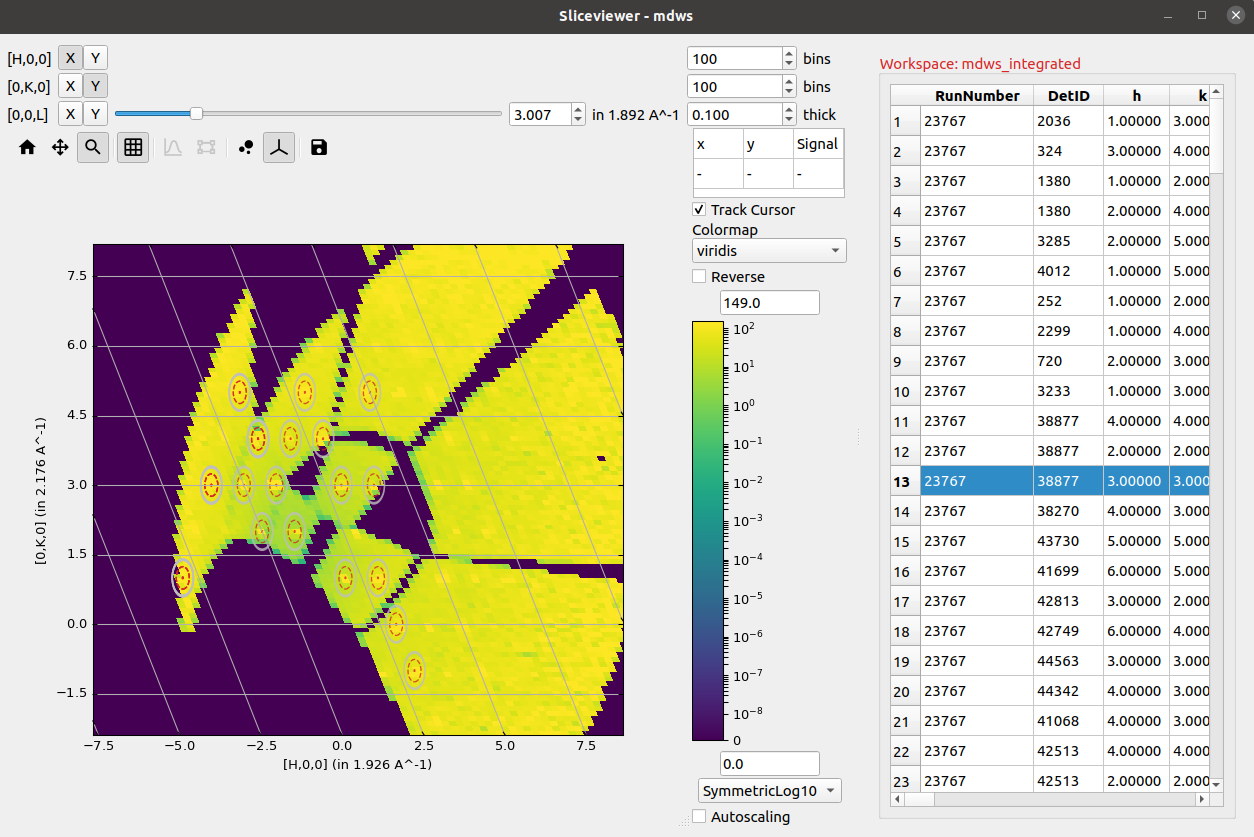
Non-Orthogonal Axes View#
If the units of an MDWorkspace are HKL and the workspace has an attached UB matrix then the option to display the image using axes aligned with the crystal (so-called non-orthogonal view) will be now be visible:
Activating this option transforms the axes taking into account the lattice angles encoded by the UB matrix:
ROI Preview & Extraction#
In addition to the single-pixel line plots that were present in the previous release, a new tool to allow selection of a rectangular region of interest has been added:

Selecting this tool enables the line plots attached to the image axes but instead of the line plots being the sum over a single pixel in the orthogonal direction the sum is now limited to the selected region:
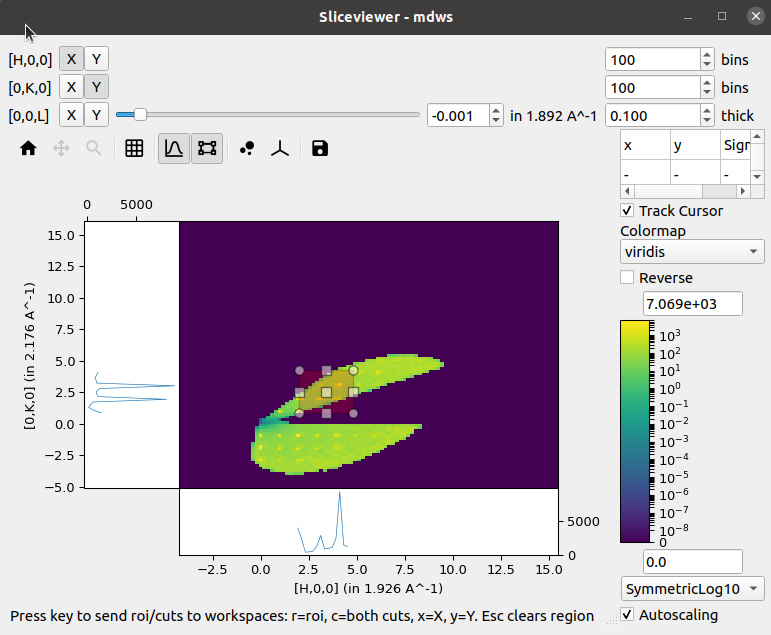
A new status bar has been added at the bottom to indicate that the cuts can be extracted to separate workspaces by using the relevant keys. Similar keys and status information is presented in the single-pixel line plots mode.
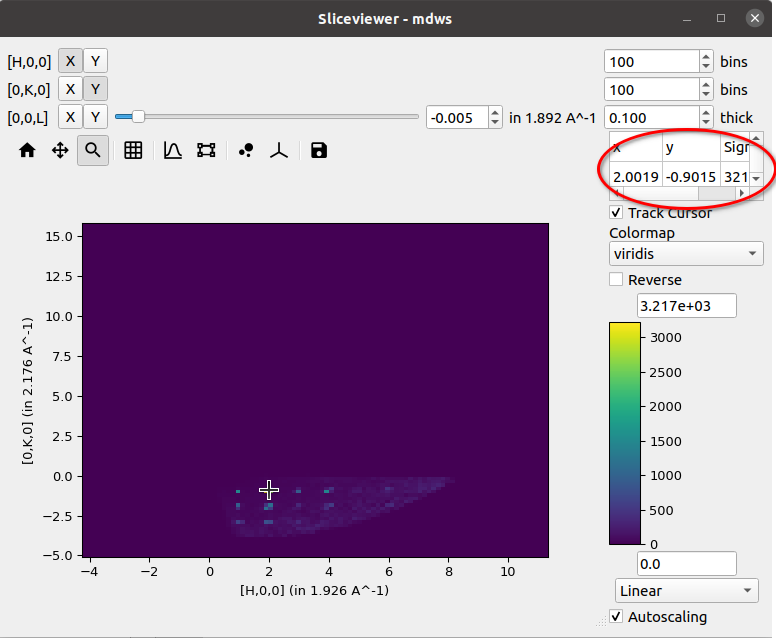
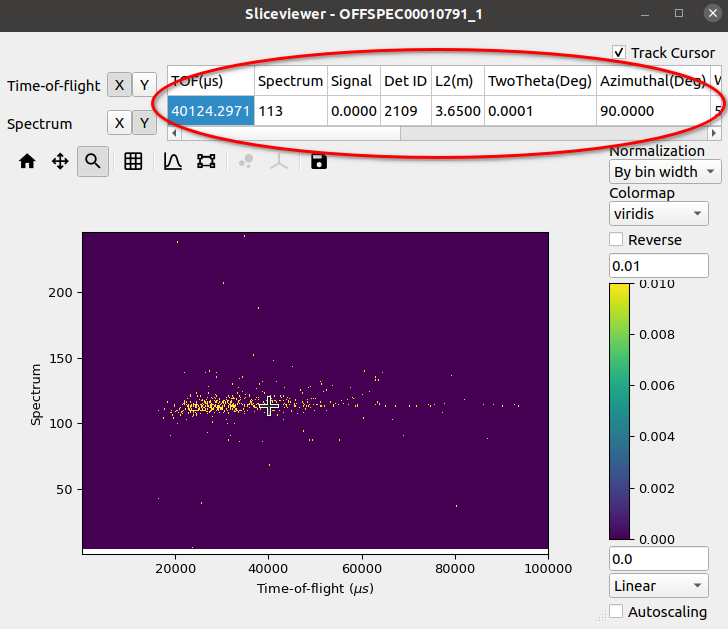
Cursor Information Widget#
The revamped Sliceviewer has merged several features from the SpectrumViewer in MantidPlot. One of these new features is the ability to show information regarding a given pixel as the mouse cursor moves of the image. The new table shows the following quantities for a MatrixWorkspace:
Signal
Spectrum Number
Detector ID
Two Theta
Azimuthal angle
Time-of-flight
Wavelength
Energy
dSpacing
|Q|
and for an MDWorkspace:
Signal
x
y