

Muon Analysis#
Note
These release notes were migrated from the retired Mantid wiki (archive.mantidproject.org).
Simply select MuonAnalysis from the MantidPlot Interfaces menu to run. Below is a list of the tabs on the interface and the changes made to them.
Home#
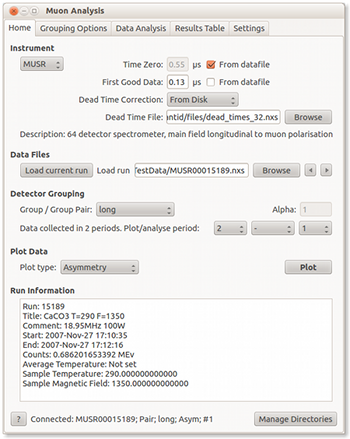
The home page hasn’t had that many changes but things to note are the next and previous buttons which have been added. These will let the user navigate to the next and previous run number without having to re-enter the run or browse to the run. Also the run information is now populated with more useful information including counts, run start, run end and the comment.
Grouping Options#

One of the major changes to this page is the fact that it is now synced to the home tab of MuonAnalysis. Feedback from users was that it was difficult to tell whether the workspace plotted was associated to the grouping options tab or the home tab because one may say Logorithms where the other tab says Counts. Mac users had a few issues loading and saving grouping files. This has now been fixed.
Settings#
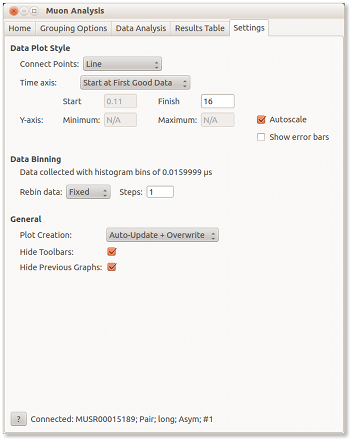
A connect points option has been added so that the user can modify how the data will be displayed each time. The options are scatter, line and symbol, and line. Some of the feedback from users told us they didn’t have enough room to see plots and operate the interface. A lot of work has gone into this. A minor thing the user can do is hide the toolbars while working within the interface. Another thing they can do is use Floating windows. To make the experience of using the interface more intuitive we added a plot creation option. This will allow the user to overwrite data and auto-update the plot if an option is changed.
Data Analysis#

This tab is new to the release. It is basically the Fit Property Browser optimised for Muon use. The peak picker tool will be assigned automatically to the workspace you choose. The layout has been rearranged and a new option has been added which allows fitting bunched data to the raw data. Sequential fit has been disabled at the request of muon scientists.
Result Table#

The tables on this tab will populate with all the log values and workspaces that have been fitted to. The user can then choose which log values to include along with which worksapces. Hitting the create table button will do what it says. The generated table will not only include the log values but the parameter values and errors as well. The user can then plot a table from this or copy the data into another program. The thing to note with this is that it only works for workspaces that have had the same fitting applied. These workspaces have been colour coordinated for ease. The log values used are the ones that appear in all workspaces and the values are chosen if they were recorded between the run start and run end.
General#
Overall there has been a big push to make the interface look and feel the same on each operating system which is why you may notice a few differences in layout from the last release. Also, all options are saved so that when the user comes back they don’t have to mess around changing the settings back to the way they want. To find out more about the interface go to MuonAnalysis.
Algorithms#
Two algorithms have been added, CalMuonDeadTime and ApplyDeadTimeCorr. The first algorithm allows the calculation of detector deadtimes and the other applies these deadtimes.