

User Interface & Usability#
Note
These release notes were migrated from the retired Mantid wiki (archive.mantidproject.org).
ImageViewer#
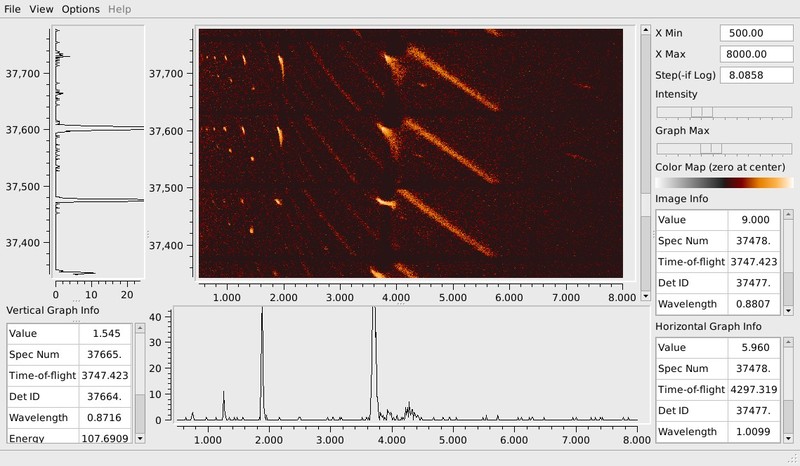
The MantidPlot ImageViewer, which was prototyped during the last iteration, is now fully operational and works with both Histogram and event data, to start it right click on a workspace and select “Image Viewer”. Specific improvements include:
Support for matrix workspaces (in addition to the event workspaces previously supported)
“Immediate” rebinning of the X-axis in either Log or uniform bins
Coordinated scrolling of the horizontal and vertical cuts along with the image
Range control for the graphs of horizontal and vertical cuts
“Two-sided” “psuedo-log” color scales to support negative intensities from subtracting workspaces
More complete readout of equivalent units for pointed at features
See the ImageViewer page for specific improvements to this tool.
New “Tof Converter” Interface#
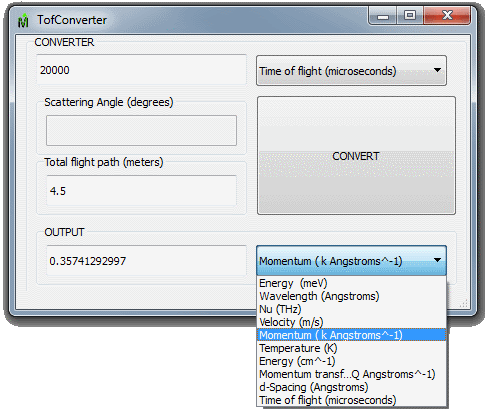
A new unit conversion interface has been added to perform simple single value unit conversion between common neutronic units. This is available from the Interfaces menu.
Other changes#
Plot refresh behaviour: if the axis of a graph have been specifically set, then they will remain fixed if the graph refreshes.
Instrument View: Unwrapped views of instruments can be plotted without using OpenGL, just uncheck “Using OpenGL” in the display settings. This uses a bit more processing power and is not as exact, but is very useful for remote desktop environments without OpenGL support.
The Curve Fitting functionality now supports TableWorkspaces as a data source, just use a graph generated from them as normal for fitting.
You can also convert QtiPlot tables direct to TableWorkspaces, using the Table menu “Convert To Table Workspace” option.
Several new colour maps have been added.
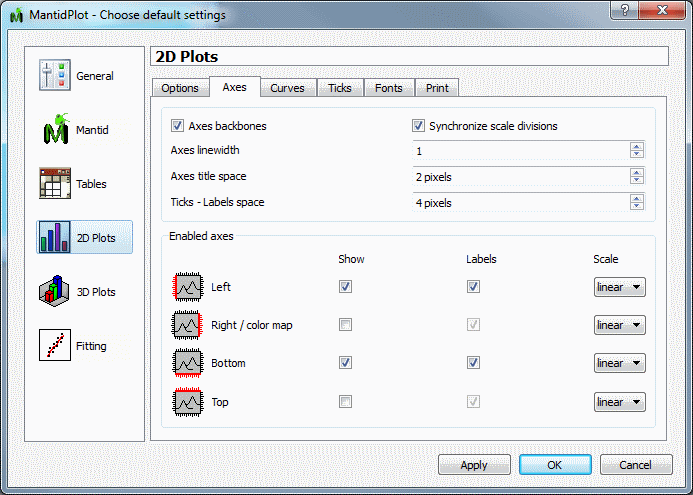
More control is availavle of the axis labelling for 2D plots for the top and right axis. Thei is controled in the Preferences Dialog, under 2D Plots->Axes
The location of windows is now correctly remembered when saving a project
Hidden algorithm categories are now saved correctly