

User Interface & Usability#
Note
These release notes were migrated from the retired Mantid wiki (archive.mantidproject.org).
ImageViewer#
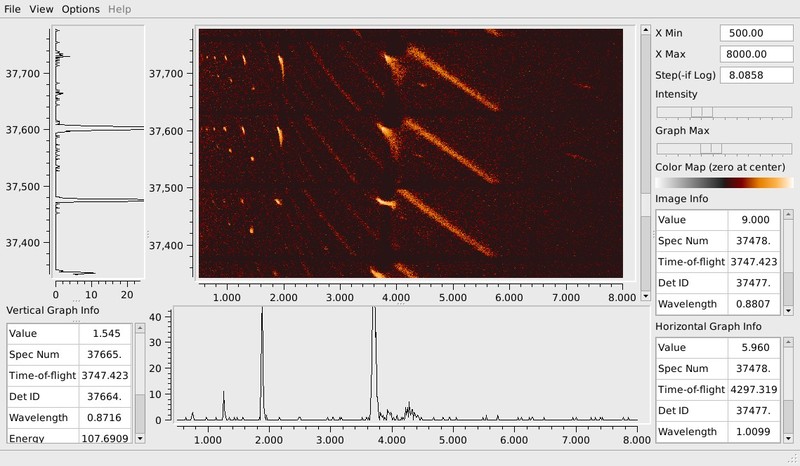
The MantidPlot ImageViewer, has been further enhanced in this release, to start it right click on a workspace and select “Image Viewer”. Specific improvements include:
It now shares the same colour maps as the SliceViewer
Direct, Indirect and elastic calculation of energy are all now supported
A bug that could cause a crash if the X range was sety incorretly has been fixed
Algorithm Selection#
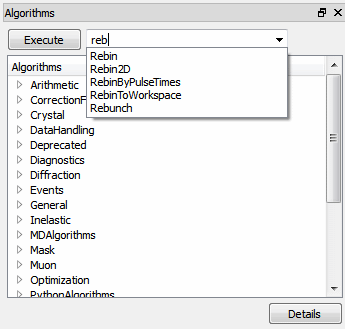
Algorithms in hidden categories are now visible in the Algorithm search box.
You can now type part of an algorithm name into the algorithm search box and hit enter, the first match will be executed.
Load algorithm with operations now copies to python correctly.
Other changes#
The colour map on 2D colour plots can will now support values below 10-8 , this was causing a problem for certain instruments
A long standing and hard to pin down bug has finally been solved. This one could cause a crash when clicking near the title on graphs, you can all feel safe to click again
Plots created with the plotBin command now will update if the underlying data in the workspace changes
Docked windows no longer appear directly on top of each other