
User Interface & Usability#
Note
These release notes were migrated from the retired Mantid wiki (archive.mantidproject.org).
New Features#
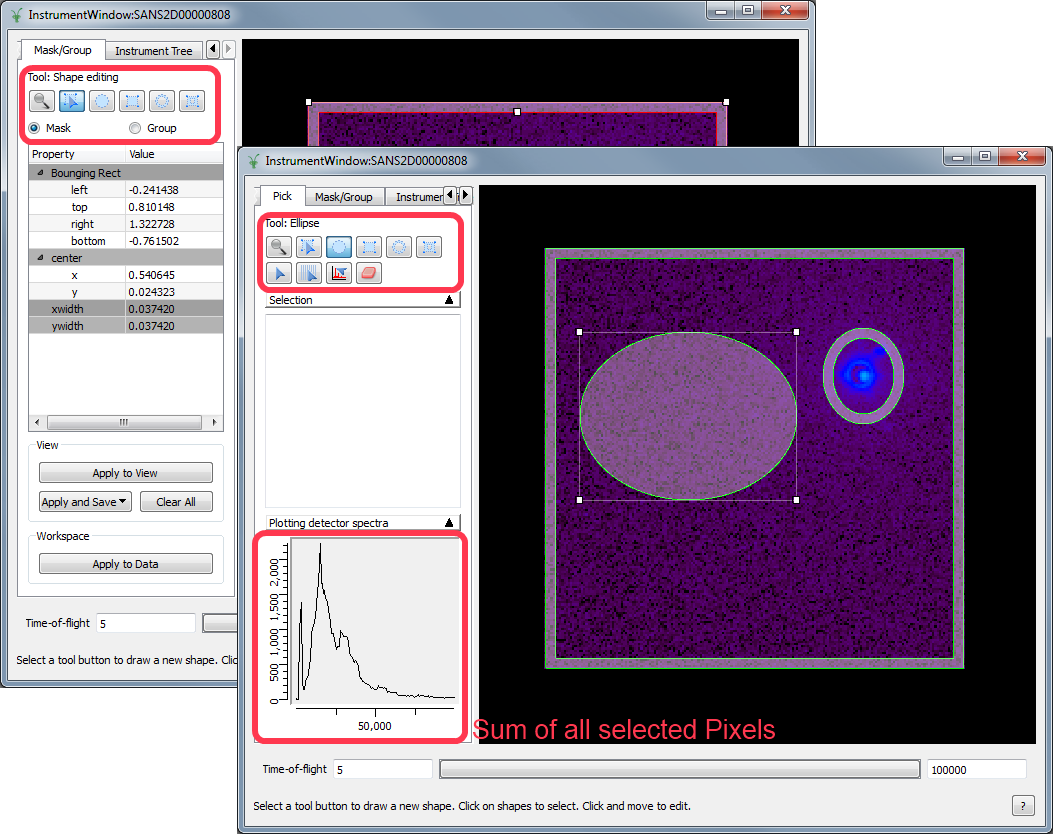
The shape tools are now shared between the Pick, mask and group tabs.#
Instrument View Changes#
The Shape selection tools (elipse, ring, rectangle etc.) are now shared between the pick mask and group tabs., You can move between the tabs to change the ‘meaning’ of any selections you have made.
To remove a shape select it using the shape editing tool and press the delete key.
In Pick mode the miniplot will display the sum of all of the pixels in all of the shapes you have defined.
1D & 2D graphs#
The screen reader tool
 will now use scientific format if the values in the graph are very high or low.
Renaming Workspaces#
You can now rename multiple workspaces in a single step. You just select multiple workspaces using shirt+left clicking with the mouse on the workspace list, then right click and select Rename. You can then select a prefix or suffix for them all, or specify replacement names.
Help Improvements#
An ‘Ask for Help’ option has added to the Help menu and project webpage to email the development team for help and make suggestions.
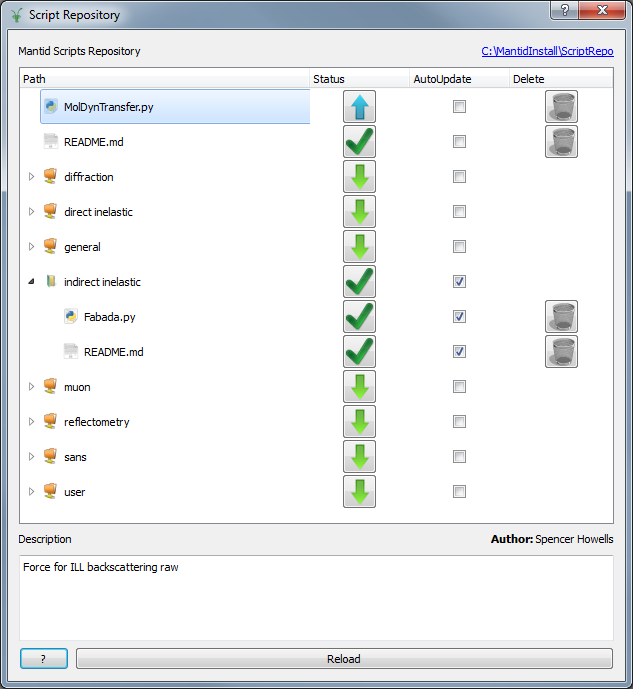
The Script Repository with autoupdate and delete functionality.#
Script Repository#
You can now delete files from the script repository, as long as you were the original author. If you need to remove a script that where you were not the original author then contect the development team.
Checking the AutoUpdate box will now allow you to mark a script to be kept current with any changes to the version in the Script Repository. Mantid will check for and download new versions on startup.
Python paths are now automatically setup for scripts you download so new libraries and scripts should work easily.
We have changed the icons used for uplodaing, downloading and current data files to they are easier to differentiate.
VATES Simple Interface (VSI)#
You can now set the centre of rotation in the standard view by selecting the Pick Center (green circle arrow with black pointer) button.
You can toggle the visibility of the 3-axis rotation centre by selecting the Show Center (green circle arrow with yellow circle) button.
You can toggle the visibility of the orientation 3-axis by selecting the Show Orientation Axes (tri-color axes with eye) button.
You can now also select between rendering types (surface, volume, points etc) in the standard view.
When selecting events to show in the Splatterplot, they are now biased to be selected from the densest regions of event rather than a purely random selection. This gives a better representation of the data with a smaller number of events.
The Splatterplot view now allows you to select individual peaks by using the Pick Mode button. Peak information can be displayed using the SCD Event Data Reduction Point Info tab.
The Splatterplot also now supports non-orthogonal axis, when defined by the UB Matrix.
For unintegrated peaks, you can now adjust the size of the peak markers, by editing the “Unintegrated Peak Marker Size” value.
You can now save screenshots from the VSI using the View->Save Screenshot menu or pressing Ctrl+Shift+R
SliceViewer#
The performance of the sliceviewer has been improved so it can now handle overlaying peaks lists with thousands of peaks.
Many more columns of information in the peaks list. Which ones are shown are dynamically determined and can be selected via the “Visible Columns” item in the “Peak” menu.
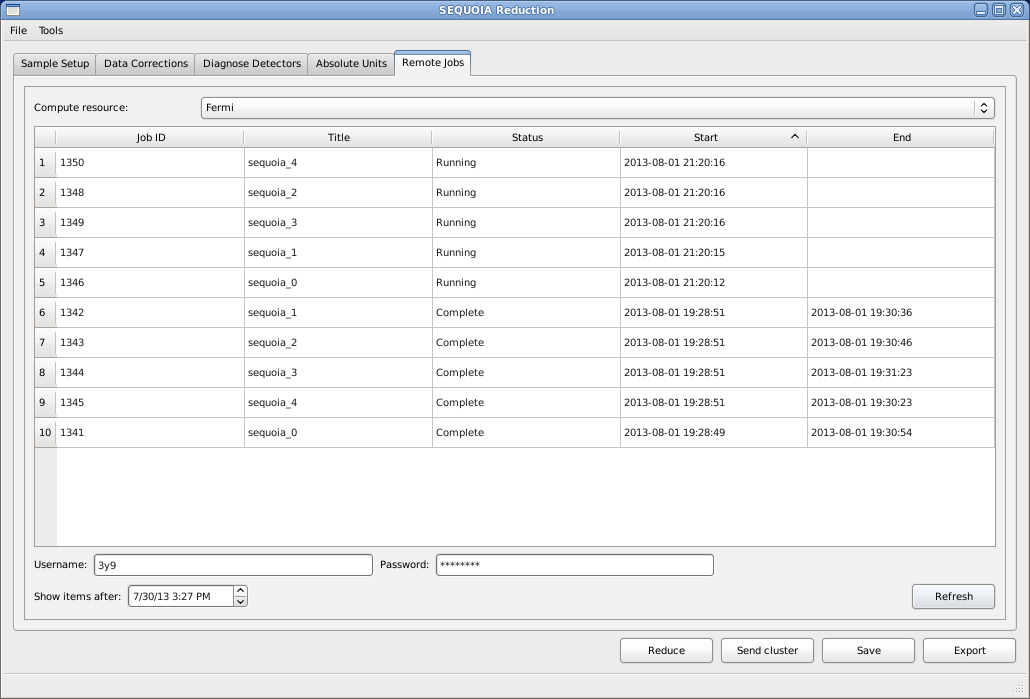
Status of parallel reduction jobs submitted from DGSReduction to the Fermi cluster at ORNL.#
Parallel Reduction#
At facilities that support this (currently ORNL) parallel reduction options have been added to the EQSANS and DGSReduction user interfaces.
You can also track the status of parallel reduction jobs in the parallel reduction status tab.
Live Data#
The DGS Reduction interface can now be used to reduce live data on ADARA-enabled beamlines at the SNS (see the Direct Inelastic section for details)