

User Interface & Usability#
Note
These release notes were migrated from the retired Mantid wiki (archive.mantidproject.org).
Default File Type#
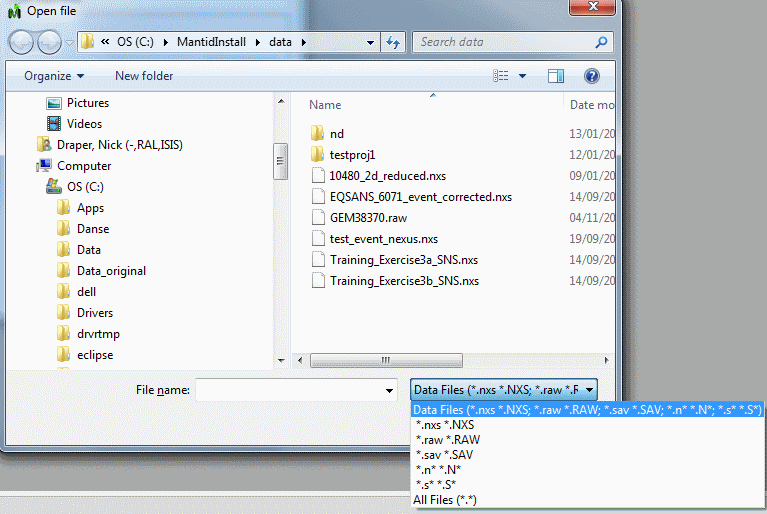
The default file extension for loading data files had been changed to include all of the common file extensions used at your selected facility. The All Files option is still available in case the extension you want is not listed.
Workspace List#
A new button has been added to the workspace list that allows you to specify how the workspaces are sorted, you can choose between alphabetical order, or have the workspaces sorted by the time they were last modified.
Plot Spectra Dialog#
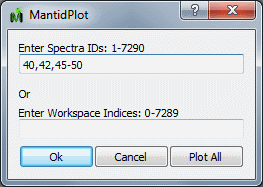
The new plotspectrum dialog box appears when you right click on a workspace and select Plot Spectrum, or Plot Spectrum with Errors. You can enter either the spectrum number, or the workspace index of the spectra you wish to plot, or you can click Plot All. The range hints above each box are accurate, and you can enter multiple spectra, or ranges if you like.
For Example:
“1,2,3,5” - Will plot the 4 selected spectra
“1-5” - Will plot the spectra 1-5 inclusive
“1-5,10,11” - Will plot 1-5, 10 and 11
Floating windows#
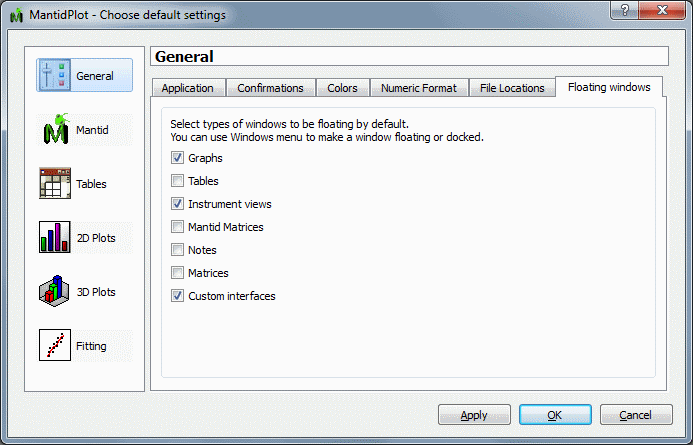
Set the preferences for floating windows in the preferecenes dialog#
Windows in Mantidplot are no longer restricted to the Mantidplot application. You can choose to “Float” or “Dock” any graph, matrix or interface you like. This is particularly useful for people with multiple monitors.
To Change a window, just click on it and select “Change to Floating” or “Change to Docked” from the Window menu. You can also set the default appearance of a type of windows in the View->Preferences dialog.
For Windows and Mac the default for Graphs and the instrument windows has been set to “Floating”, but you can change that if you wish. For Linux the graphs have a tendency to hide behind the application window, so they have not been enabled by default, but will work if selected, or individual windows are floated.
Algorithm category changes#
The categories for the algorithms in Mantid were in dire need for an overhaul, with the majority of algorithms in the catch all “General” category. This has all been changed into a sensible category structure. Please note that algorithms can (and are in several cases) be in several categories, and you can hide categories that are not of interest to you in the view->preferences box.
Instrument view changes#
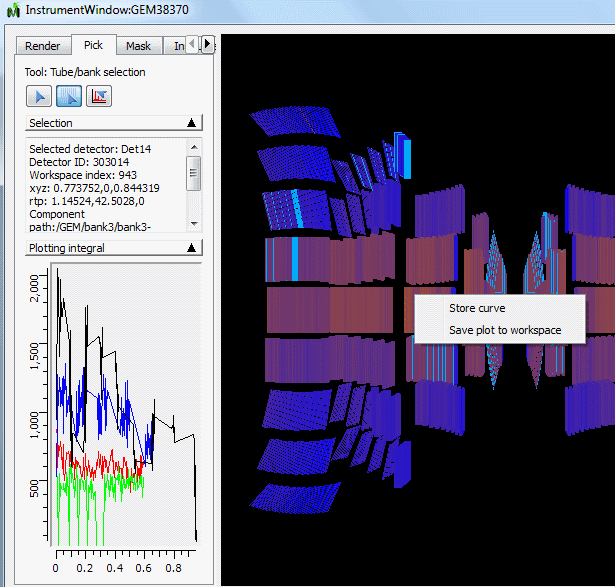
Changes to the instrument window#
Flip unwrapped view#
You can now flip the unwrapped view of any instrument to see the detectors from the other side, simply check the flip box on the render tab.
Store curves#
Within the pick tab you can now store curves on the miniplot to compare against others. To do this right click where you want to store the curve on the miniplot and select “Store Curve”, this will freeze that curve on the miniplot and it will be displayed in addition to any others. Please Note: If the curve is not visible then it is likely that the axes you are plotting are not compatible between the curves, for example if you are plotting detector id, then the stored curve will not be visible when you move to another detector bank. Try the new tube length axis.
Axes options for integrated tubes/banks (det id, tube length, Phi)#
We have added a new Tube Length axis for use when selecting integrated tubes or banks, it displays the integrated value as a function of the distance along the tube or bank. The detector Id axis is still available as in the previous version.
Export to workspace#
If you have selected one or more interesting curves in the miniplot and want to perform some further analysis on this data you can export to a separate workspace, by right clicking and selecting “Save Plot to Workspace”. This will save the miniplot data to a workspace called “curves”, with one spectra per line in the plot.
Displaying Peak Lists#
If you have extracted a peaks workspace, either manually, using one of the peak search algorithms or by using PredictPeaks you can overlay this onto the unwrapped view of the instrument, by dragging the peaks workspace onto the instrument display.